TI-89 / TI-92 Plus / Voyage™ 200 PLT Statistics with List Editor App Getting Started 13
Example: Producing Another Residual Plot with the New Data
The new function y1=.192283 … x^.522498 appears to fit the data well. To get more information,
examine a residual plot.
1. Press 2 a to return to the list editor.
2. Turn off all plots and functions.
¦ Press „ (
Plots) and select 3:PlotsOff to turn off all plots.
¦ Press „ (Plots) and select 4:FnOff to turn off all
Y = functions.
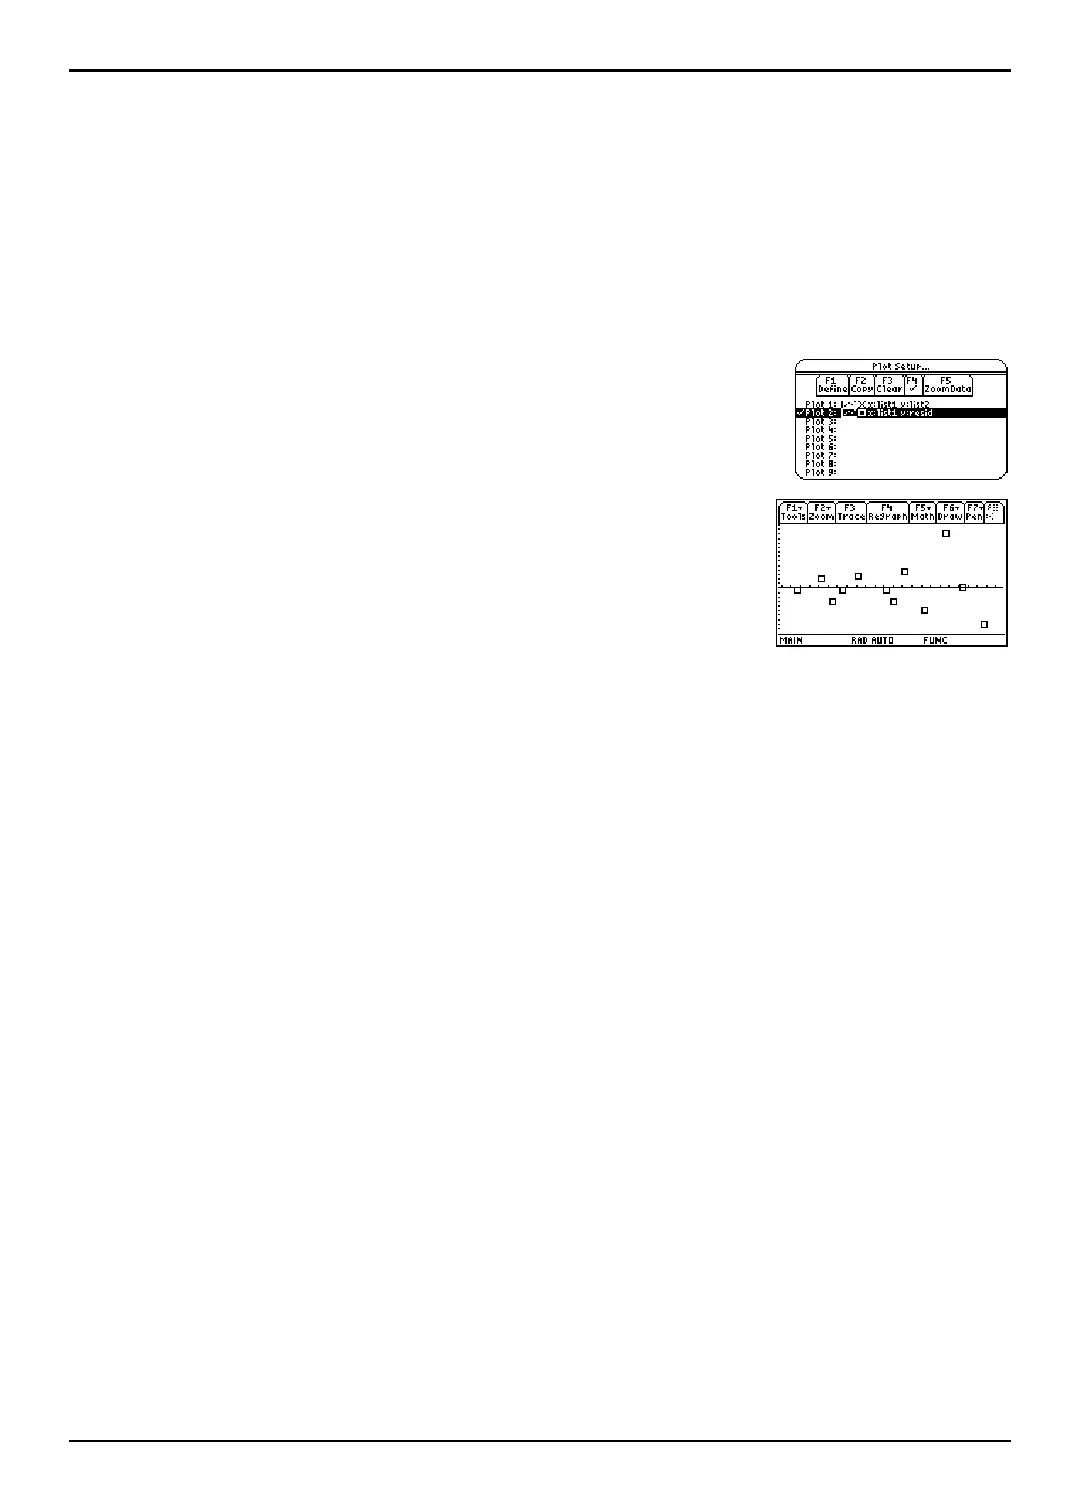
3. Press „ (Plots) and select 1:Plot Setup to display the Plot
Setup
dialog box. Highlight Plot 2 and press † Ÿ to select
it.
4. Press ‡ (ZoomData). The window variables are adjusted
automatically, and
Plot2 is displayed. This is a scatter plot
of the residuals.
The new residual plot shows that the residuals are random in sign, with the residuals
increasing in magnitude as the string length increases.

 Loading...


