TI-89 / TI-92 Plus / Voyage™ 200 PLT Statistics with List Editor App ‰ Ints (Intervals) Menu 184
2-SampTInt
Description
2 ‰ (
Ints) Æ 4:2.SampTInt for the TI-89
‰ (Ints) Æ 4:2.SampTInt for the TI-92 Plus / Voyage™ 200 PLT
2.SampTInt (two-sample t confidence interval) computes a confidence interval for the
difference between two population means (m
1
Nm
2
) when both population standard
deviations (s
1
and s
2
) are unknown. The computed confidence interval depends on the
user-specified confidence level probability.
Data Inputs
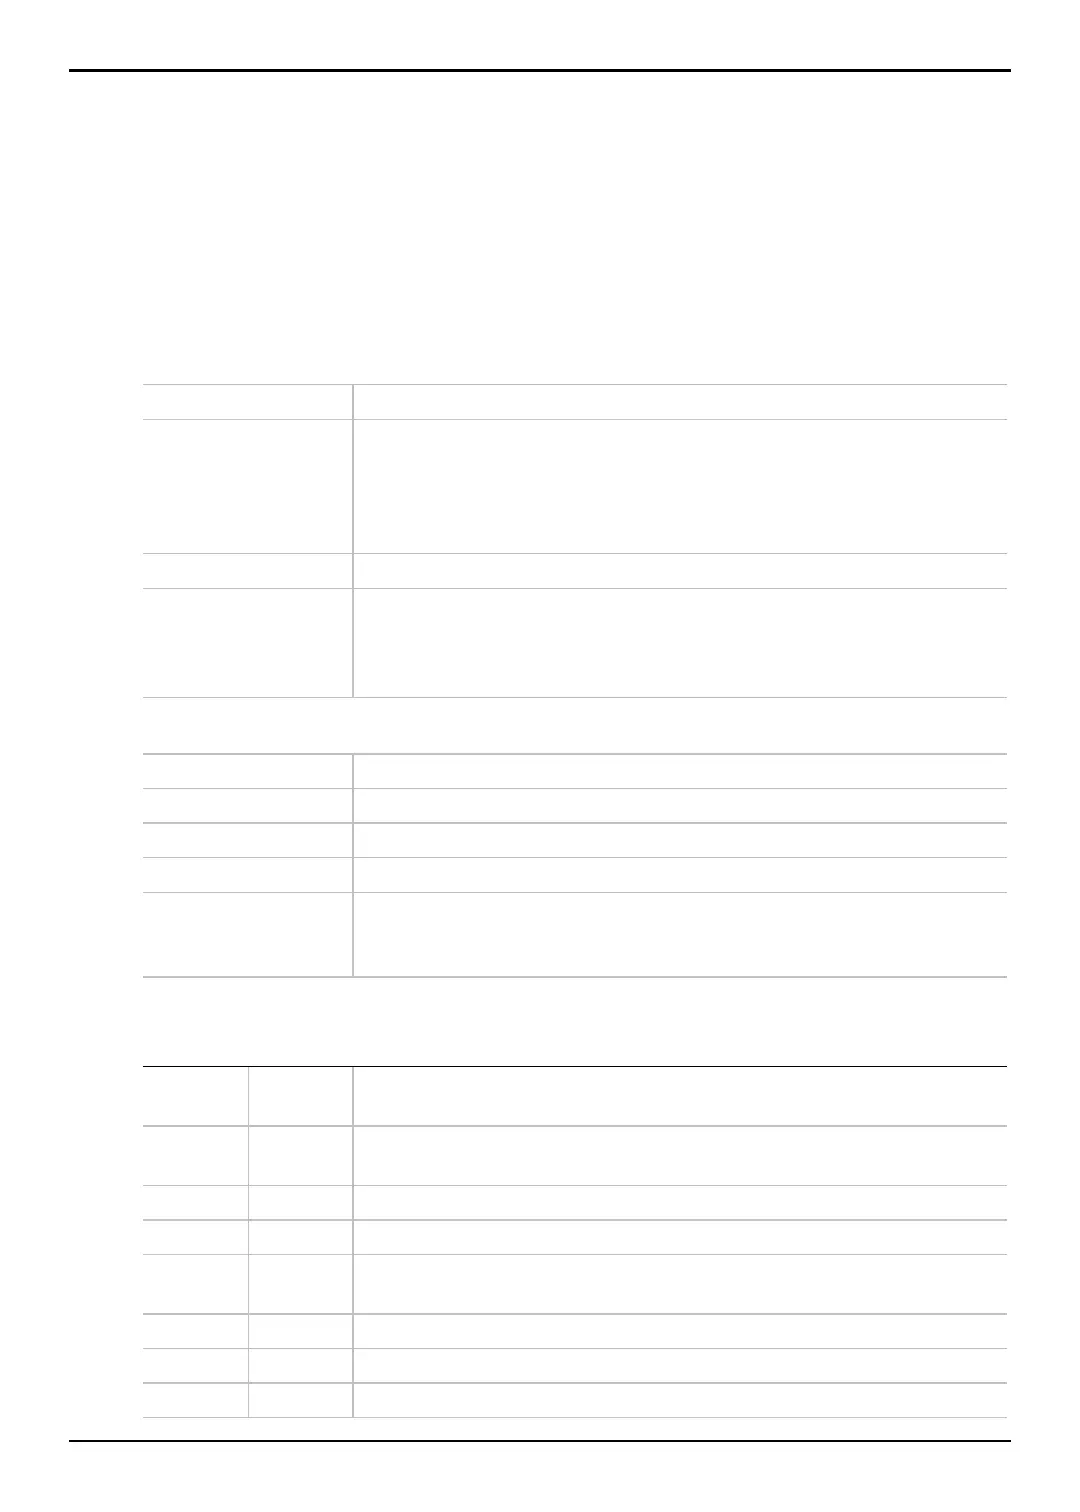
List 1, List 2 Sample data sequences from the normal random distribution.
Freq 1, Freq 2
(optional)
The name of the lists containing the frequency values for the data in
List
1
and List 2. The default is 1. All elements must be real numbers |0.
Each element in the frequency
(Freq) lists is the frequency of occurrence
for each corresponding data point in the input list specified in the
List
fields.
C Level Confidence level probability with default = .95
Pooled
(NO,YES)
Specifies whether or not the variances are to be pooled for the
calculation.
YES
= variances pooled. Population variances are assumed to
be equal. Select NO = variances not pooled. Population variances can be
unequal.
Stats Inputs
Sx1, Sx2 Standard deviation for sample 1 and sample 2.
x1, x2 Means for sample sequences from normal random distributions.
n1, n2 Length of the data sequences with means x1 and x2.
C Level Confidence level probability with default = .95
Pooled
(NO,YES)
Specifies whether or not the variances are to be pooled for the calculation.
YES = variances pooled. Population variances are assumed to be equal.
Select
NO = variances not pooled. Population variances can be unequal.
Data and Stats Outputs
Outputs Stored to Description
C Int lower,
upper
Confidence interval containing confidence level probability of
distribution.
x1-x2 xbardiff Sample means of the data sequences from the normal random
distribution.
ME me Margin of error.
df df Degrees of freedom.
x1, x2 x1_bar,
x2_bar
Sample means of the data sequences from the normal random
distribution.
Sx1, Sx2 sx1, sx2 Sample standard deviations for List 1 and List 2.
n1, n2 n1, n2 Number of samples in data sequences.
Sxp Sxp The pooled standard deviation. Calculated when Pooled = YES.

 Loading...


