TI-89 / TI-92 Plus / Voyage™ 200 PLT Statistics with List Editor App Getting Started 9
Example: Fitting a Line to the Data
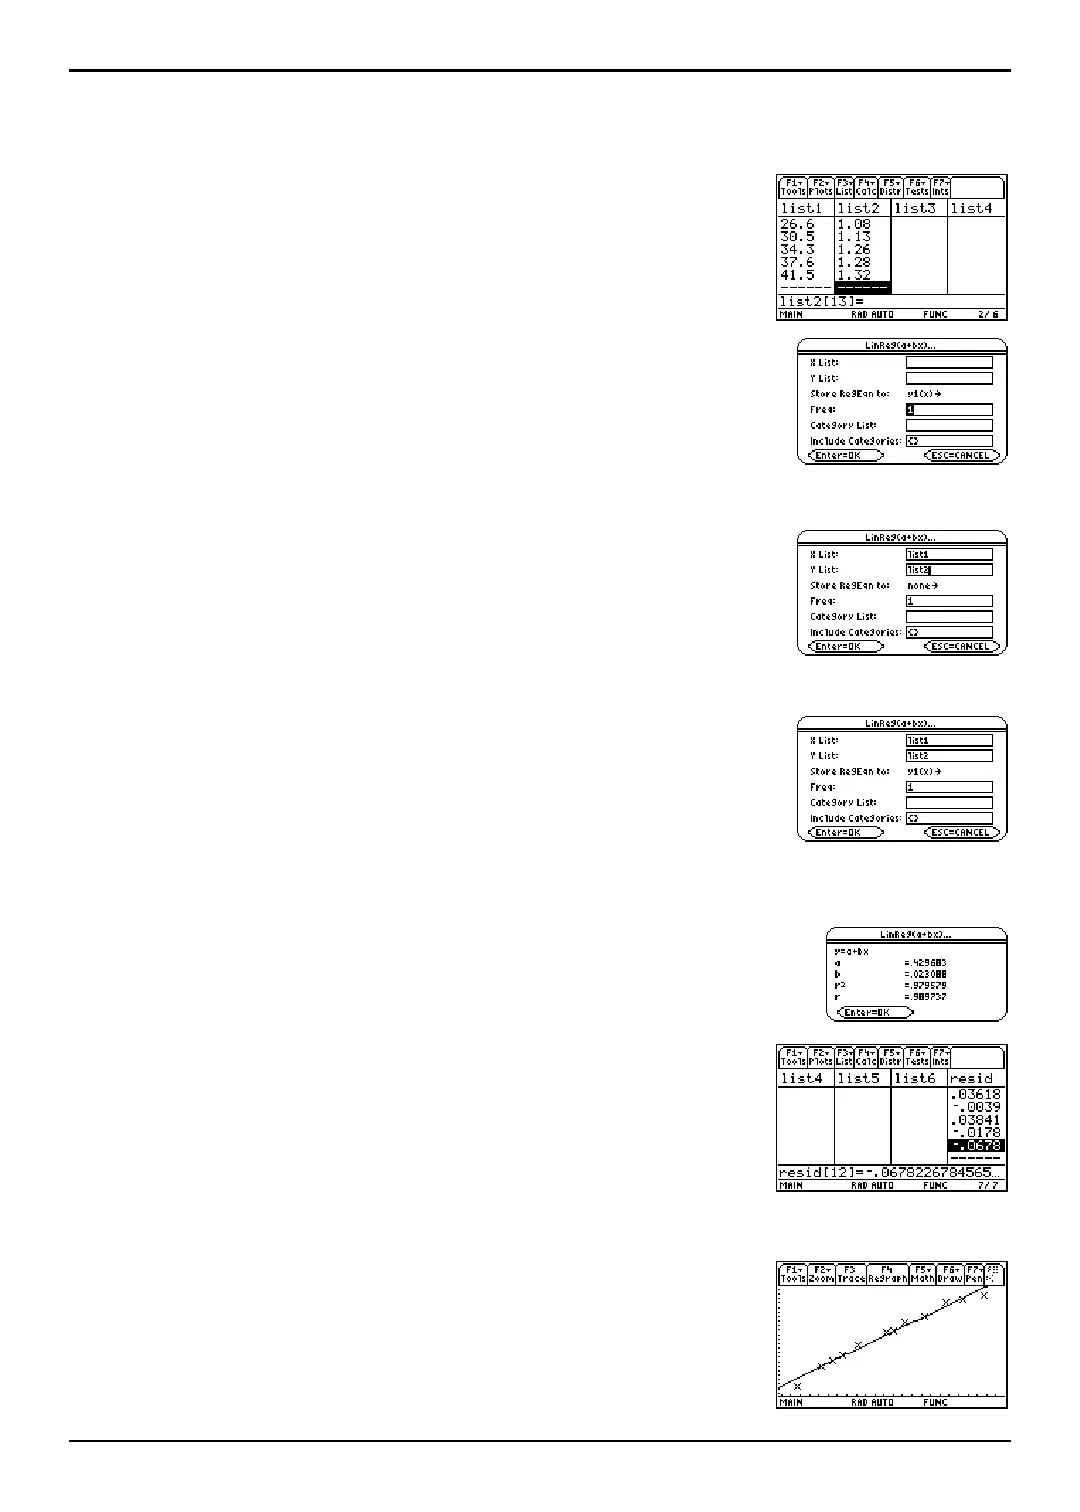
Since the scatter plot of time-versus-length data appears to be approximately linear, fit a line to the
data.
1. Press 2 a to return to the list editor.
2. Press † (Calc) and select 3:Regressions to display the
Regressions menu. Then select
1:LinReg(a+bx) to display
the
LinReg(a+bx) input dialog box.
Note: This example shows all dialog boxes with no lists stored.
Your calculator screen may show prepopulated X List and Y List
fields.
3. Press 2 ° to display the VAR-LINK [All] menu.
Highlight
list1 and press Í to specify list1 for the X List
field.
4. Press D to move the cursor to the Y List field. Press
2 ° to display the
VAR-LINK [All] menu, highlight
list2, and press Í to specify list2 for the Y List.
5. Press D to move the cursor to the Store RegEqn to field and
press B. Highlight
y1(x) and press Í to store the
regression equation (
RegEqn) variable to the y1(x) equation
variable.
6. Leave Freq, Category List, and Include Categories at their
defaults, as shown in the
LingReg(a+bx) dialog box to the
right.
7. Press Í to execute the linear regression LinReg(a+bx)
and display the results. The linear regression for the data
in
list1 and list2 is calculated. Values for a, b, r
2
, and r are
displayed. The linear regression equation is stored in
Y1.
8. Press Í. The residuals are calculated and stored
automatically in the
resid list, which is then pasted in the
last column of the list editor.
Note: To prevent the resid list from being pasted to the end of the
list editor, press ƒ 9:Format to display the FORMATS dialog box,
Change the Results->Editor setting to NO, and then press Í.
resid is stored in the STATVARS folder.
9. Press ¥ % to graph the data. The regression line and
the scatter plot are displayed.

 Loading...


