TI-89 / TI-92 Plus / Voyage™ 200 PLT Statistics with List Editor App Getting Started 15
Example: Making Predictions with the Model
Now that you have a good model for the relationship between length and period, you can use
the model to predict the period for a given string length. To predict the periods for a pendulum
with string lengths of 20 cm and 50 cm, continue with these steps.
1. To display the Home screen, press:
¦ Press " for the TI-89
¦ Press ¥ " for the TI-92 Plus
¦ Press ¥ " for the Voyage™ 200 PLT
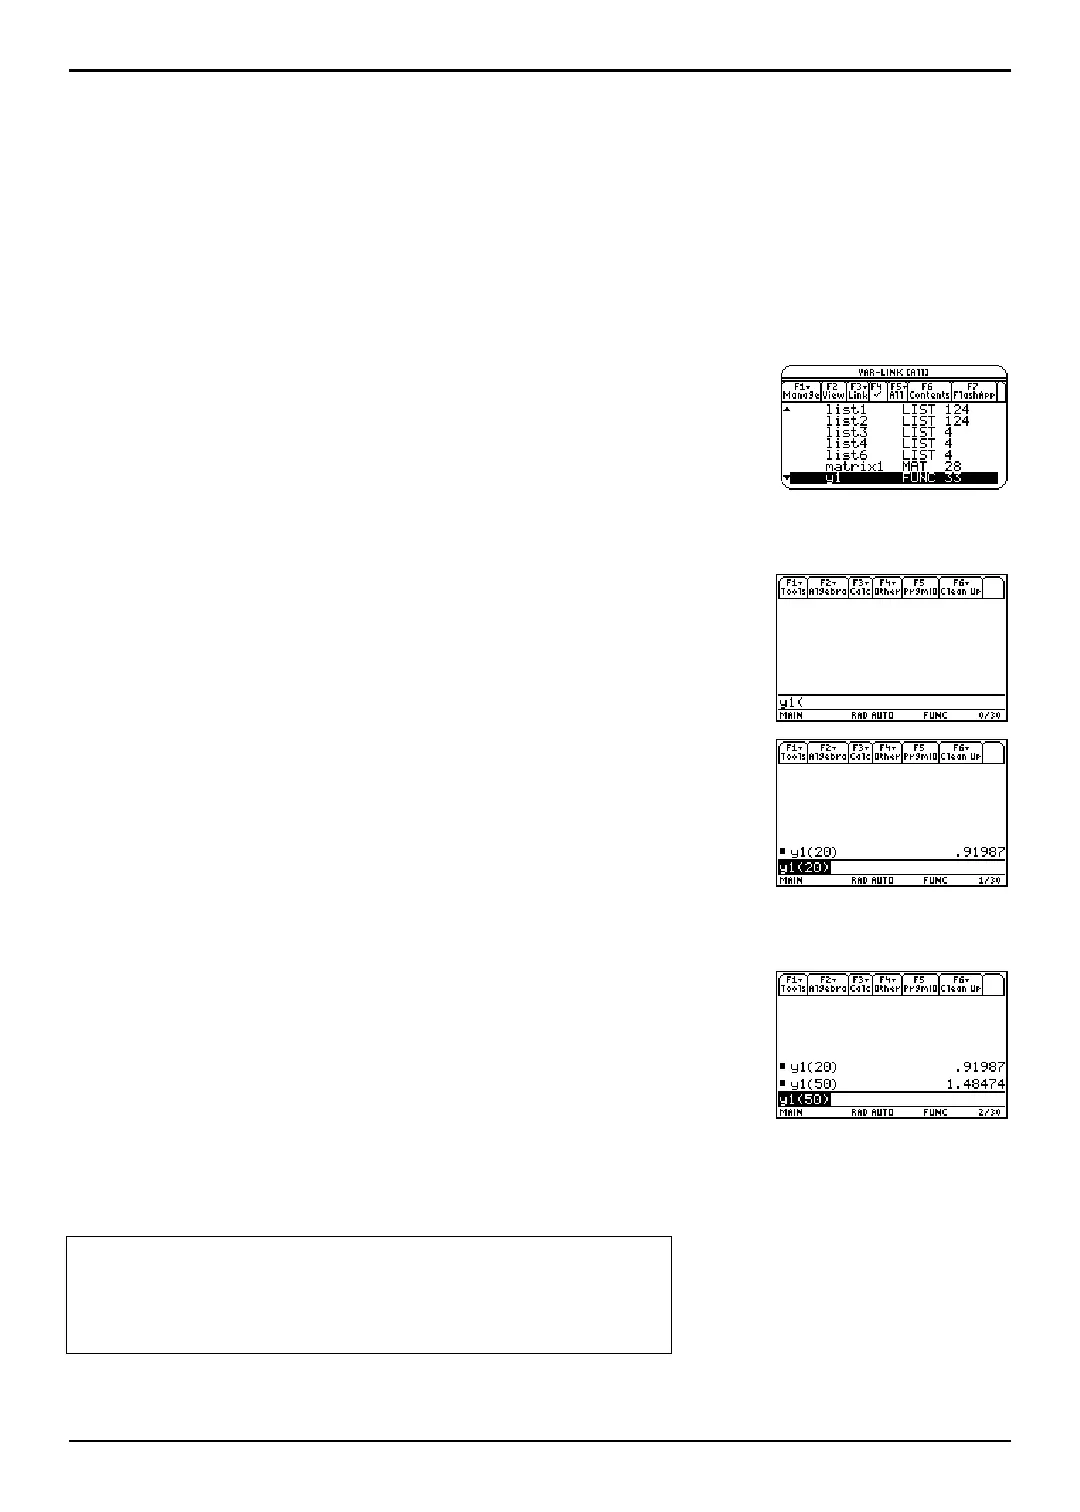
2. Press 2 ° to display the
VAR-LINK [All] menu.
Highlight the
y1 variable.
Note: If the contents of the MAIN folder are not displayed, highlight
the MAIN folder, and then press B to expand it. You can then
access y1.
3. Press ¸ to paste y1( to the entry line in Home screen.
4. Type 20 and press ¤ to enter a string length of 20 cm.
Press Í.
Based on the residual analysis, we would expect the prediction of about 0.92 seconds to be
within about 0.02 seconds of the actual value.
5. Since the last entry is still highlighted, press B A A 0 5
to change the string length to 50 cm.
6. Press Í to calculate the predicted time of about 1.48
seconds.
Since a string length of 50 cm exceeds the lengths in the data set, and since residuals
appear to be increasing as string length increases, we would expect more error with this
estimate.
From the text Contemporary Precalculus through Applications
Copyright 1999,1992. Everyday Learning Corporation
Exercise Set 6 from Chapter 1 . Data Analysis One, pages 21, 22, and
23

 Loading...


