TI-89 / TI-92 Plus / Voyage™ 200 PLT Statistics with List Editor App Getting Started 10
Example: Producing a Scatter Plot of the Residuals
The regression line appears to fit the central portion of the scatter plot well. However, a
residual plot may provide more information about this fit.
1. Press 2 a to return to the list editor.
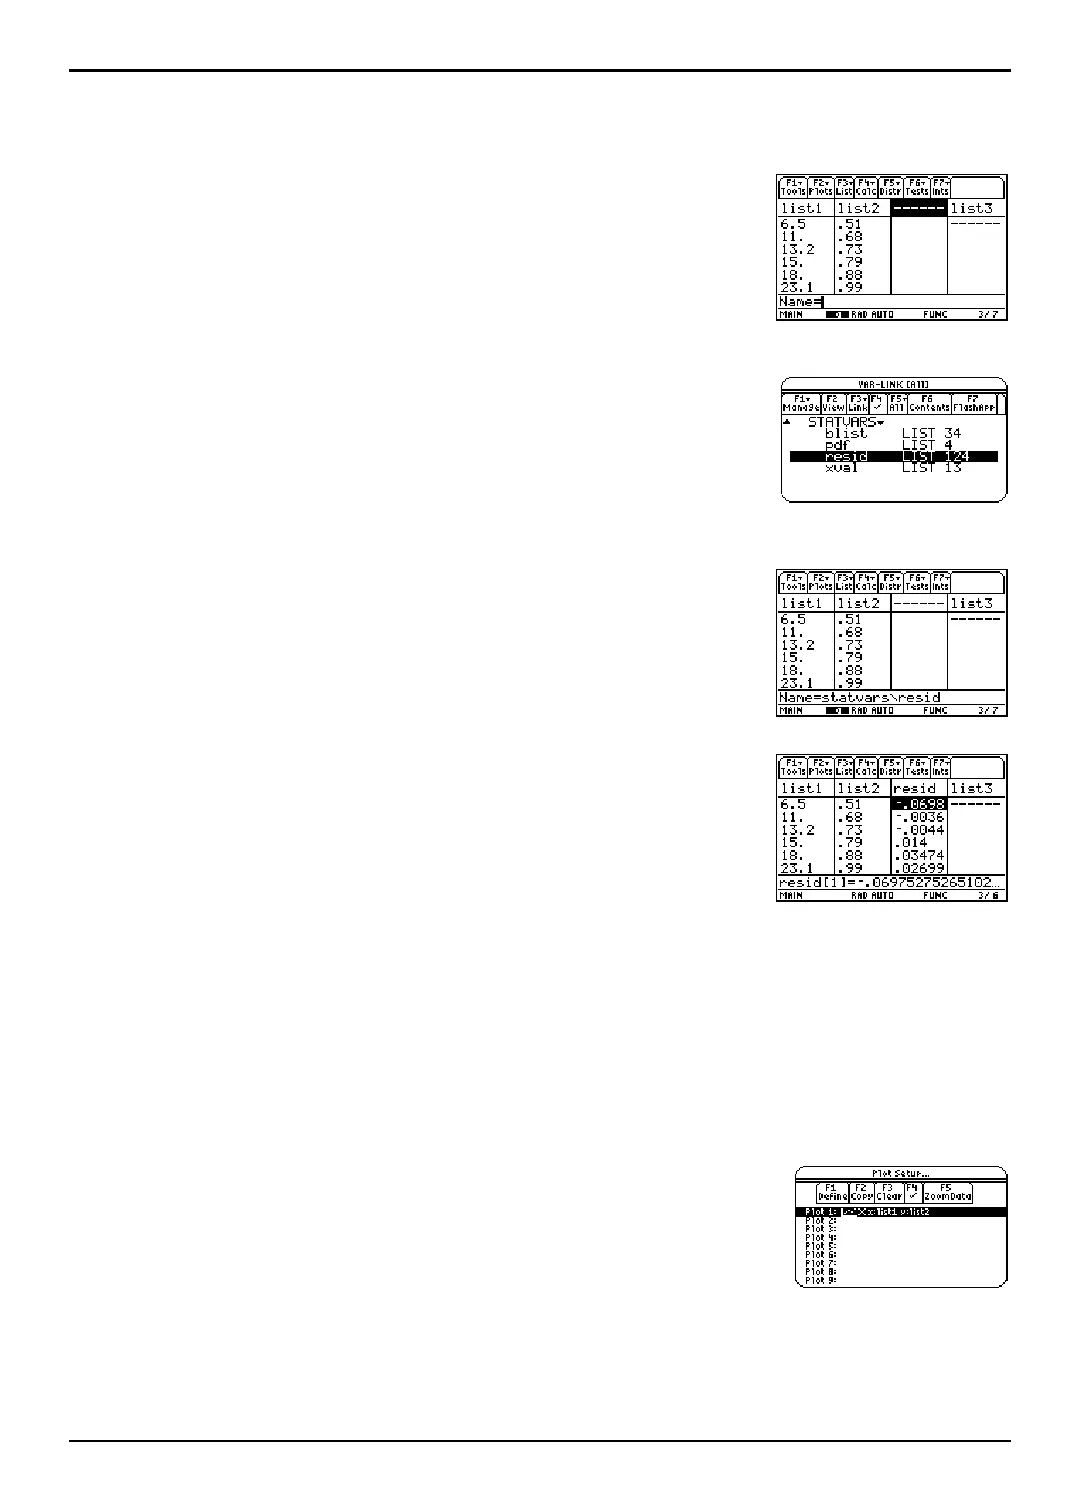
Use the arrow keys to move the cursor onto
list3.
Press y /. An unnamed column is displayed in column
three, and the remaining lists shift to the right one
column. The
Name= prompt is displayed in the entry line,
and alpha-lock is on.
2. Press … (List) and select 1:Names to display the VAR-LINK
[All]
menu. Highlight the resid variable, which is stored in
the
STATVARS folder.
Note: If the contents of the STATVARS folder are not displayed,
highlight the STATVARS folder and press B to expand it. You can
then access resid.
3. Press Í to paste resid to the entry line.
Note: Notice the path name in the entry line. If you paste a variable
name that is not in the current folder, the variable’s path name is
pasted as well.
4. Press Í. resid is moved from the last column to column
three of the list editor.
Notice that the first three residuals are negative. They correspond to the shortest pendulum
string lengths in
list1. The next five residuals are positive, and three of the last four are
negative. The latter correspond to the longer string lengths in
list1. Plotting the residuals will
show this pattern more clearly.
5. Turn off all plots and functions.
¦ Press „ (
Plots) and select 3:PlotsOff to turn off all plots.
¦ Press „ (Plots) and select 4:FnOff to turn off all
Y = functions.
6. Press „ (Plots) and select 1:Plot Setup to display the Plot
Setup
dialog box.

 Loading...


