TI-89 / TI-92 Plus / Voyage™ 200 PLT Statistics with List Editor App „ Plots Menu 38
Norm Prob Plot (Normal Probability Plot)
Description
„ (
Plots) Æ 2:Norm Prob Plot
Norm Prob Plot
plots each observation X in a list versus the corresponding quantile z of
the standard normal distribution. If the plotted points lie close to a straight line, the
plot indicates that the data are normal.
Plot Number
Select the plot number. Only the available (not already defined) plot
numbers are displayed.
(Plot 1...9)
List Enter a valid list name in the List field.
Data Axis
Select
X or Y for the Data Axis field.
If you select
X, the calculator plots the data on the x-axis and the
z-values on the y-axis. If you select
Y, the calculator plots the data on
the y-axis and the z-values on the x-axis.
Mark
Select the Mark you want to use for the plot: Box (›), Cross (x), Plus
(+),
Square (0), or Dot (ø).
Store Zscores to Enter a list variable name where you want to store the zscores.
Example
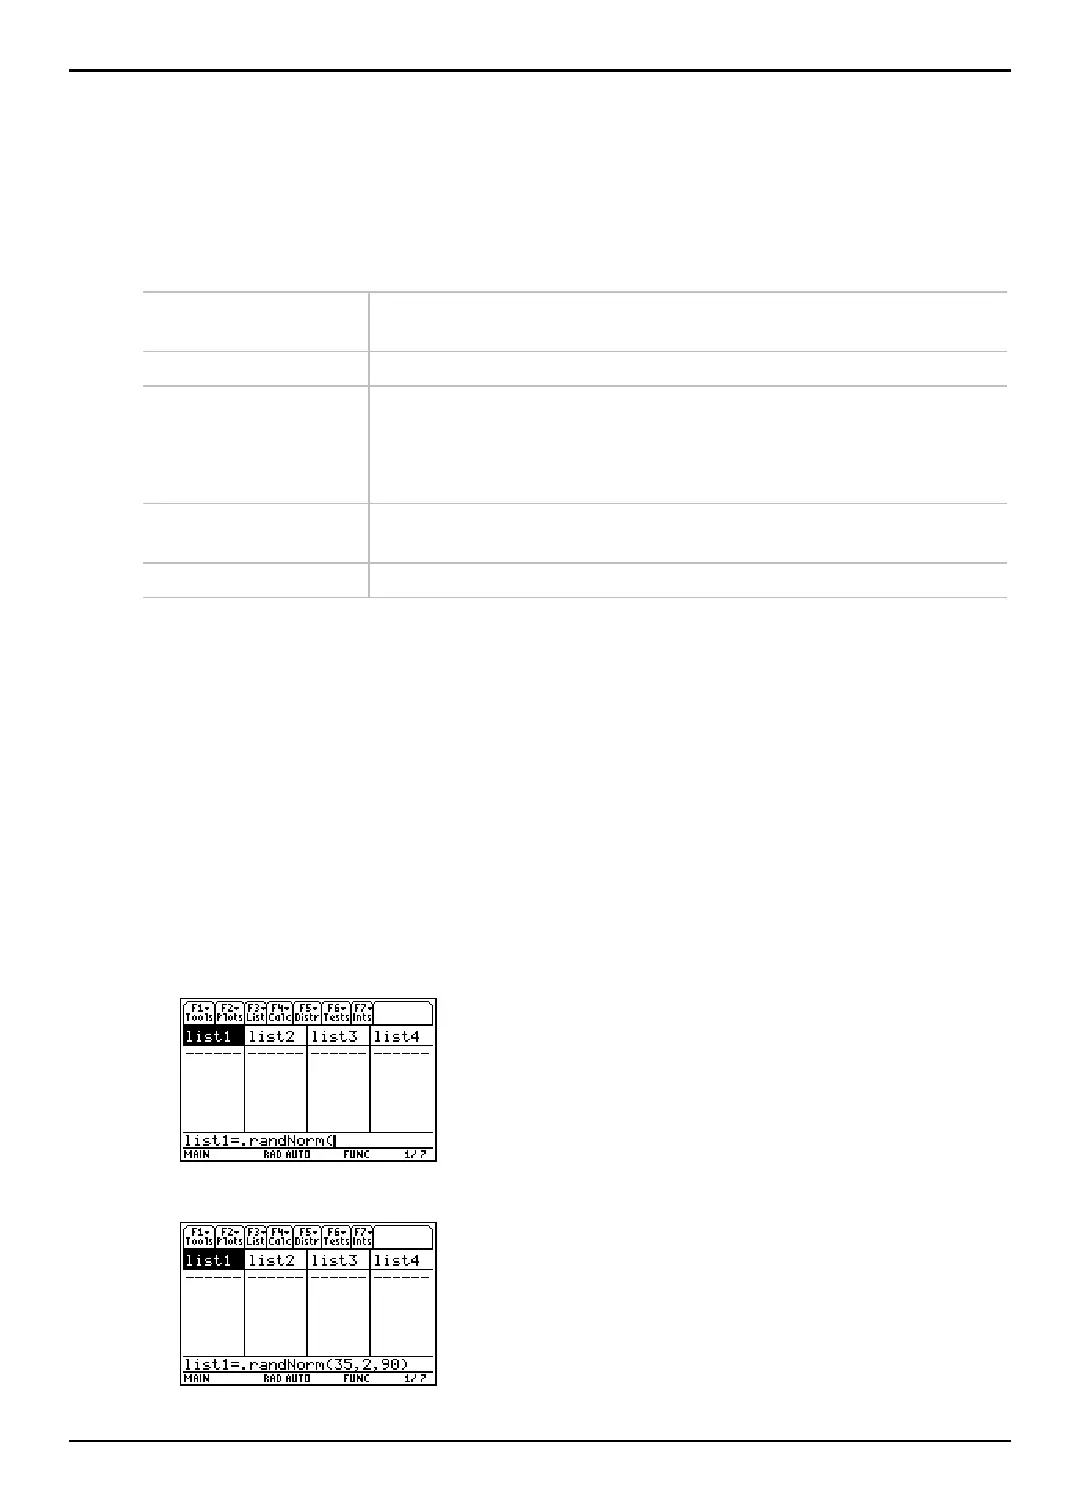
Use the .randNorm function in the † (Calc) menu to generate and display a list of
random numbers using m = 35, s = 2, and NUMTRIALS= 90.
randNorm(m, s[,NUMTRIALS])
Store the results to list1, and then use the Norm Prob Plot function to plot each
observation of
X in a list versus the corresponding quantile z of the standard normal
distribution.
1. Press „ (Plots) and select 3:PlotsOff to turn off all plots for graphing. Press „ (Plots)
and select
4:FnOff to deselect all Y = functions.
2. Highlight list1, press † (Calc) and select 4:Probability. Then select 6:.randNorm( to
paste the
.randNorm( function to the entry line.
3. Enter the arguments for .randNorm( in the entry line as shown below.

 Loading...


