TI-89 / TI-92 Plus / Voyage™ 200 PLT Statistics with List Editor App „ Plots Menu 39
Norm Prob Plot (Normal Probability Plot) (continued)
Example (continued)
4. Press ¸ to build a list of random numbers.
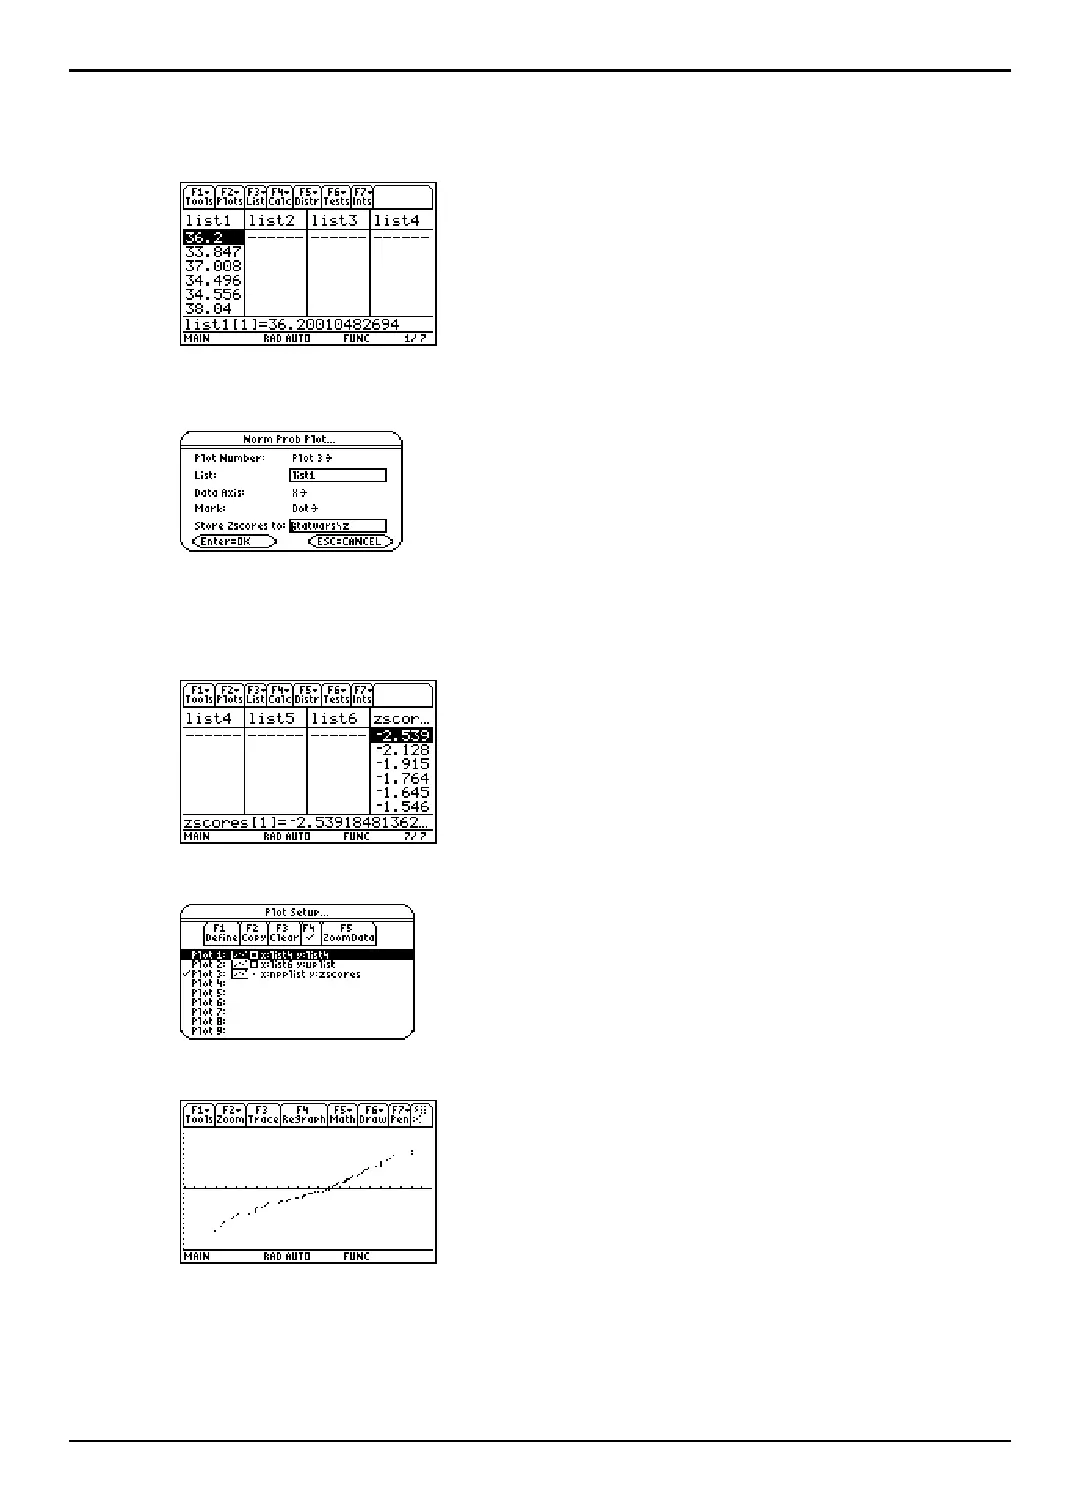
5. Press „ (Plots) and select 2:Norm Prob Plot to display the Norm Prob Plot dialog box.
Use the arguments as shown below.
Note: Use the default list variable name in the Store Zscores to input box. The “statvars/zscores”
variable name is truncated in the screenshot above.
6. Press ¸ to paste the zscores to the end of the list editor.
7. Press „ (Plots) and select 1:Plot Setup to display the Plot Setup dialog box.
8. Press ‡ (ZoomData) to display the Norm Prob Plot (Normal Probability Plot).

 Loading...


