TI-89 / TI-92 Plus / Voyage™ 200 PLT Statistics with List Editor App „ Plots Menu 35
„ Plots Menu
Plot Setup.............................................................................................................................................36
Norm Prob Plot (Normal Probability Plot) .........................................................................................38
PlotsOff (Plots Off) and FnOff (Functions Off)..................................................................................40
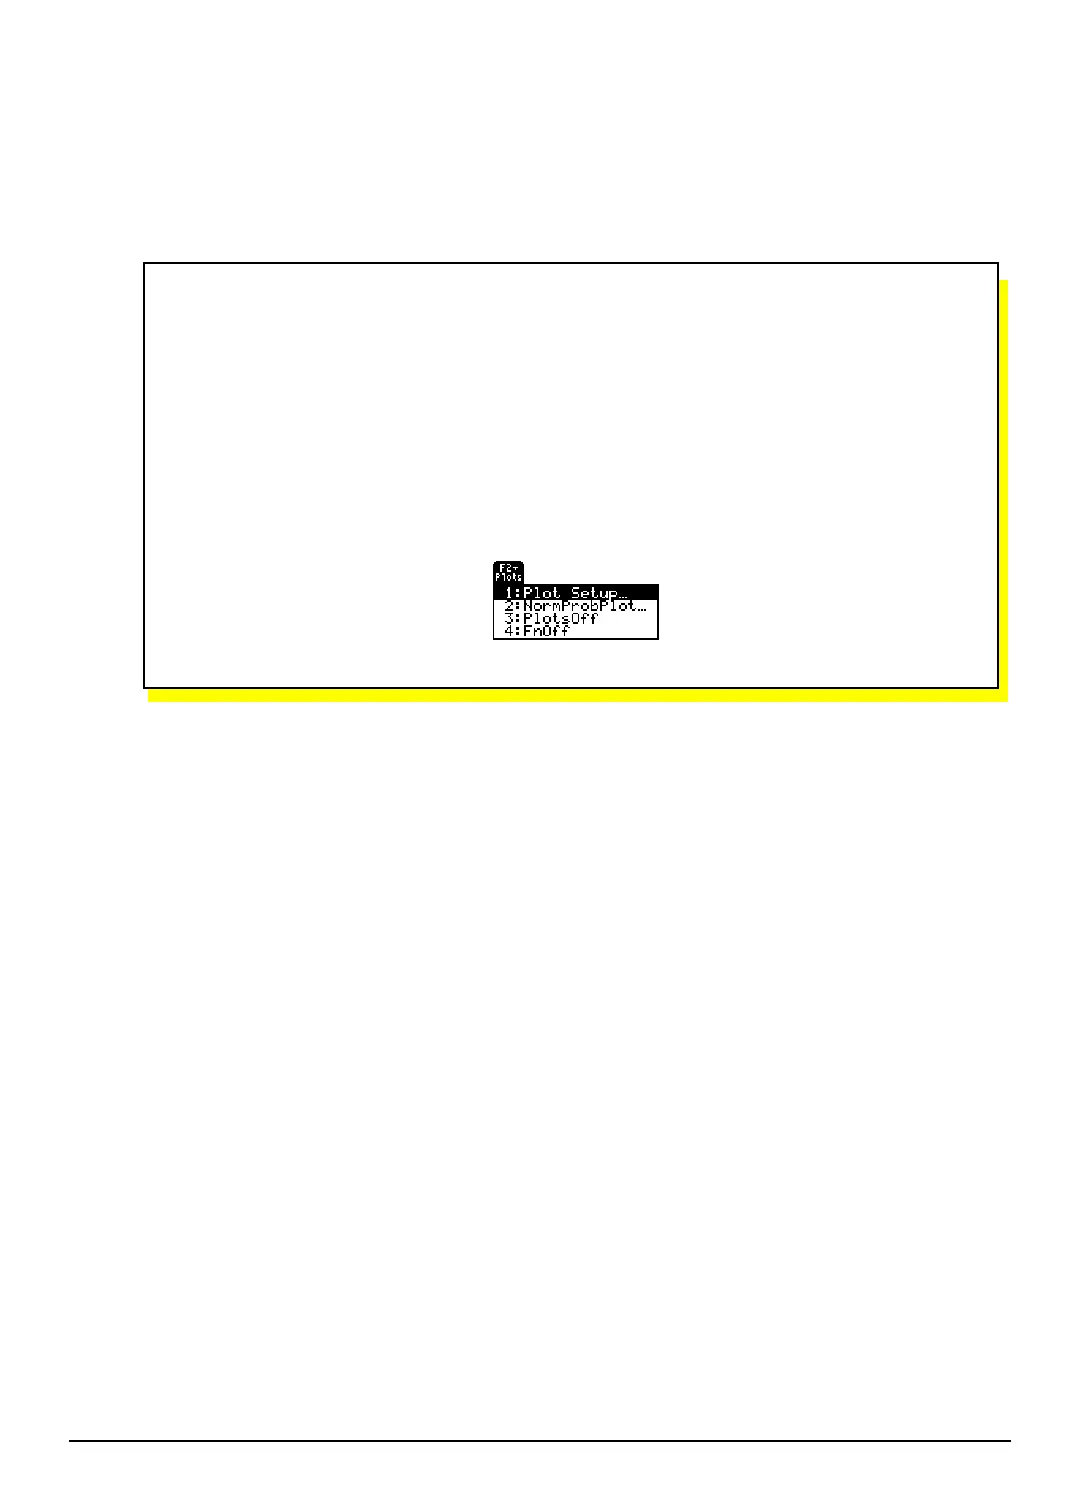
The „ (Plots) menu allows you to produce plots of your data. Plots are
graphical representations of data that have been stored in lists. Before you can
define plots, you must create the lists. Stat/List Editor application plot types
include Scatter, xyline, Box Plot, Histogram, Modified Box Plot, and Normal
Probability Plot.
Note: This chapter assumes that you know how to create lists using the Stats/List Editor application. If
necessary, review the information on creating lists in the Lists and … List Menu chapters in this user
guide.

 Loading...


