TI-89 / TI-92 Plus / Voyage™ 200 PLT Statistics with List Editor App ‡ Distr (Distribution) Menu 118
Shade t
Description
‡ (
Distr) Æ 1:Shade Æ 2:Shade t
Shade t
draws the density function for the Student-t distribution specified by
Deg of Freedom, df and shades the Area between Lower Value and Upper Value.
Inputs
Lower Value A scalar lower value. The default is Lˆ.
Upper Value A scalar upper value. The default is ˆ.
Deg of Freedom, df A scalar value for degrees of freedom.
Auto-scale
(NO, YES)
Lets you clear all drawings from the current graph and automatically
optimizes graphing window dimensions. The default =
YES.
Outputs
The output for this function is a graph with the Area between Lower Value and Upper Value
shaded
.
Output statistic variables are stored in the STATVARS folder.
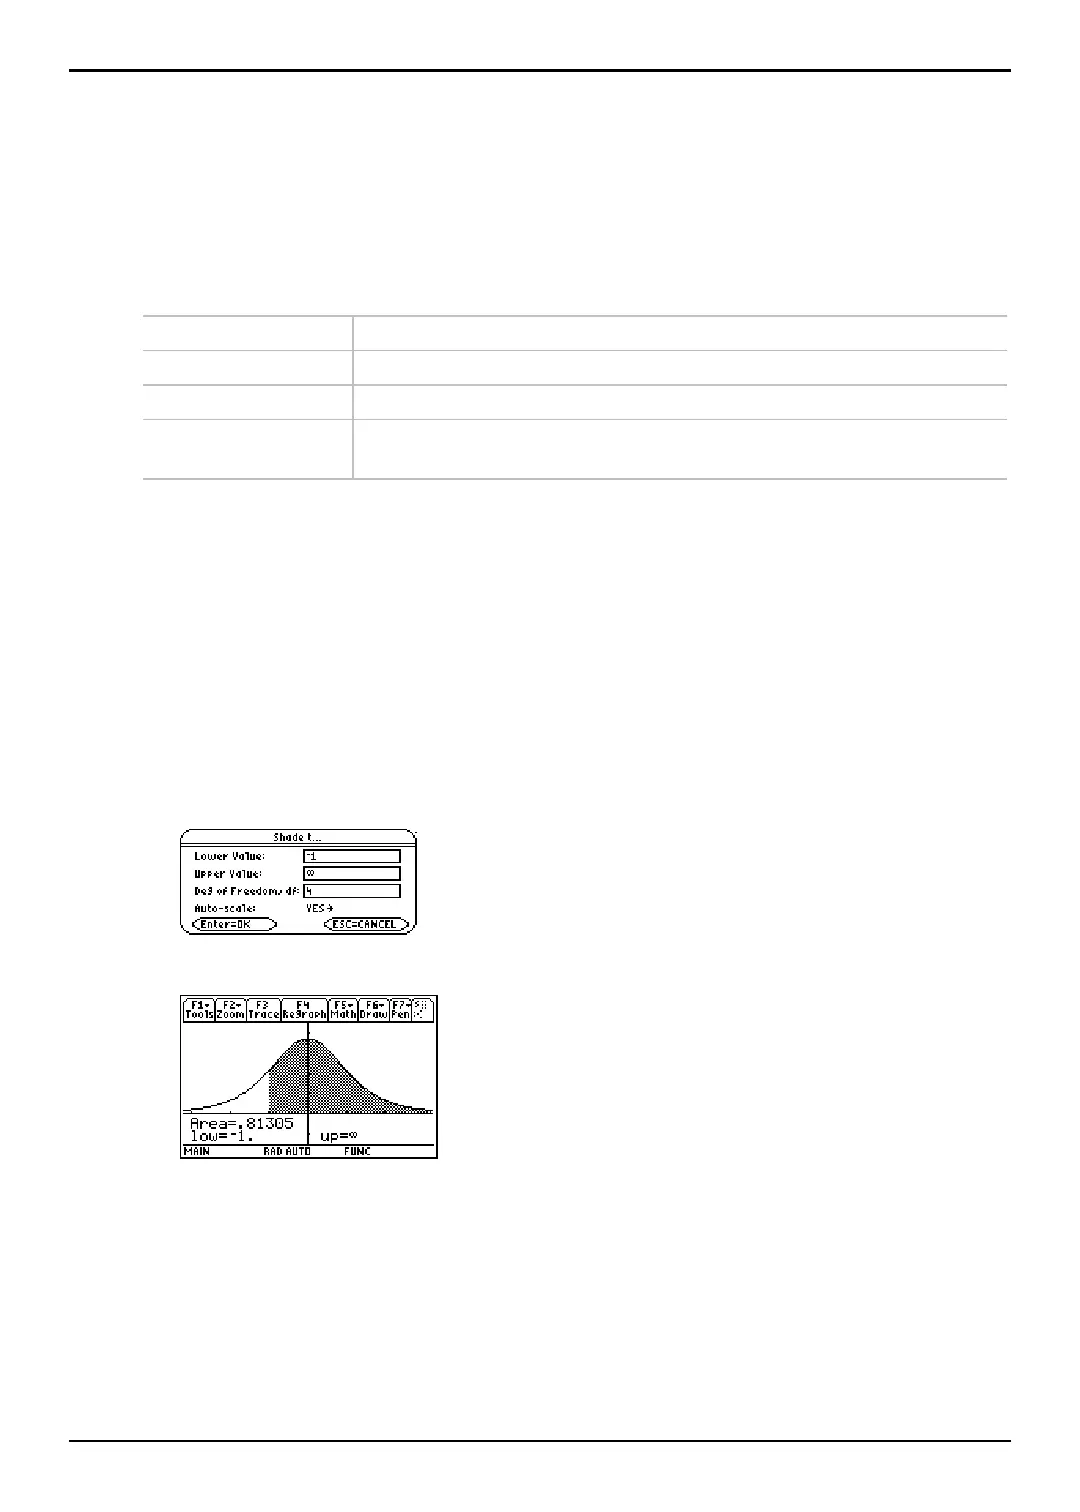
Example
1. Press ‡ (
Distr) and select 1:Shade to display the Shade menu.
2. Select 2:Shade t to display the Shade t dialog box.
3. Enter the arguments as shown below.
4. Press b to compute the data.
Note:
After completing a Shade function and viewing the graph,
press 2 a to return to the Stats/List Editor.

 Loading...


