TI-89 / TI-92 Plus / Voyage™ 200 PLT Statistics with List Editor App Getting Started 7
Example: Plotting the Data
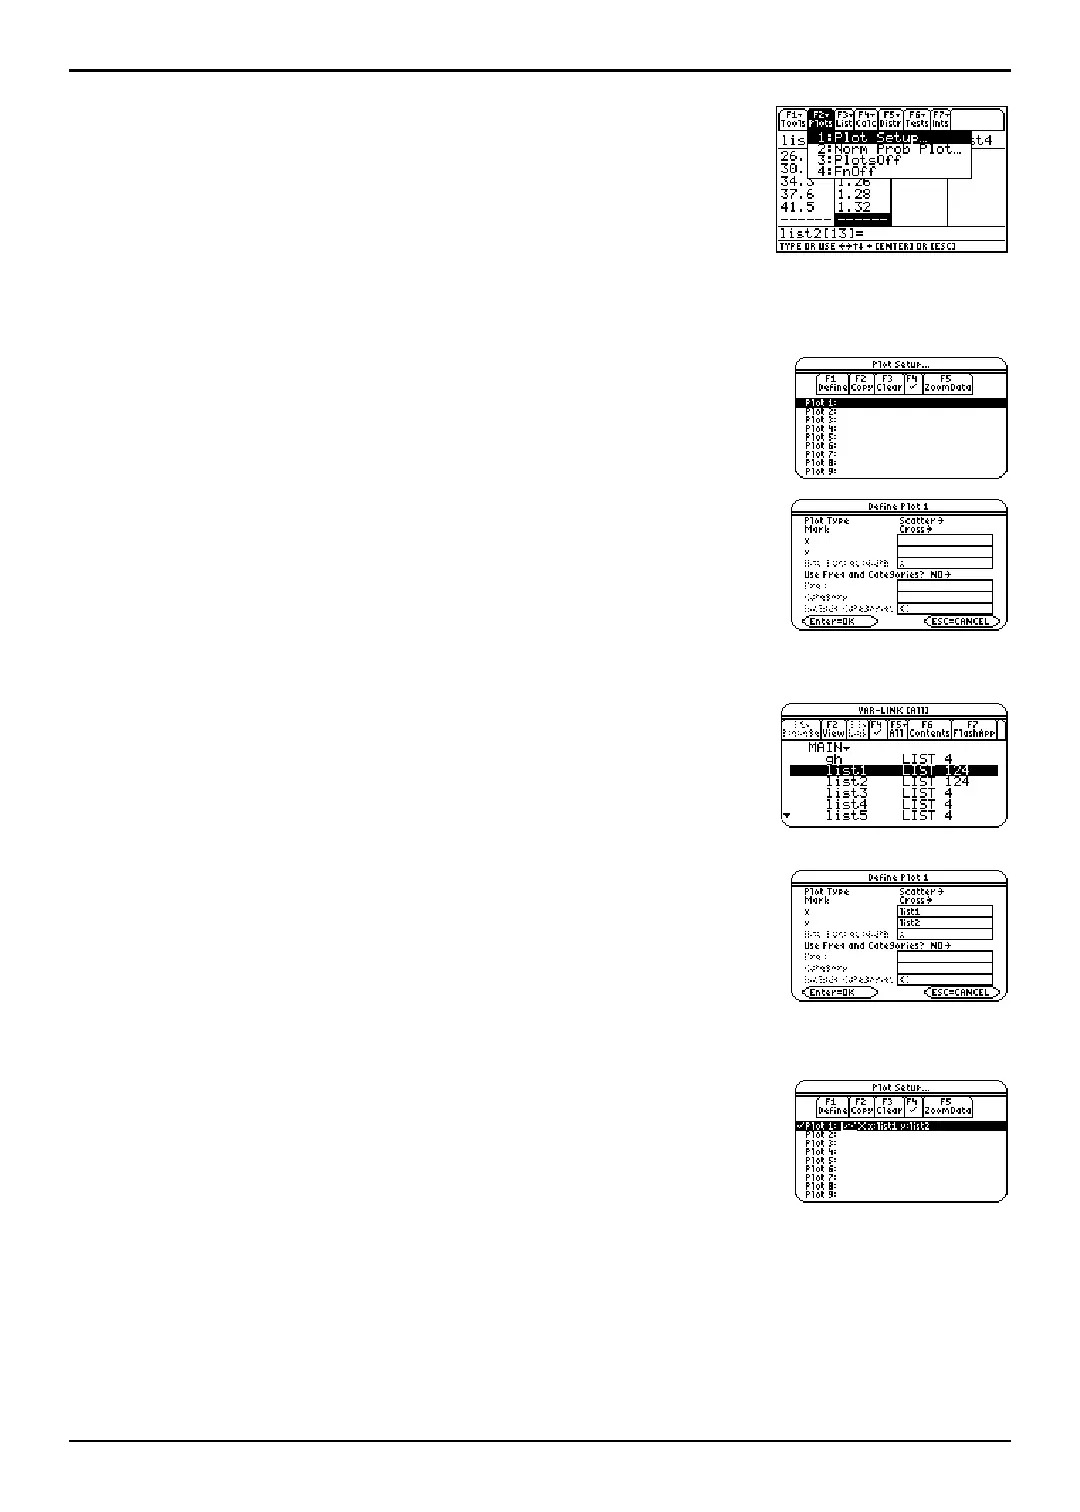
1. Press „ (Plots) to display the F2 Plots menu.
2. From the F2 Plots menu:
¦ Select 3:PlotsOff to turn off all plots.
¦ Select
4:FnOff to turn off all Y = functions.
3. Press „ (
Plots). Select 1:Plot Setup to display the Plot Setup
dialog box.
Note: Your Plot Setup dialog box may not look exactly like the one
shown here.
4. Highlight Plot 1 and press ƒ (Define) to display the Define Plot 1
dialog box.
5. If
Scatter is not displayed, press B and select 1:Scatter.
6. Press D. If Cross is not displayed, press B and select
2:Cross (+) for the type of mark used for each data point on
the scatter plot.
7. Press D to move the cursor to the x field. Then press
2 ° to display the
VAR-LINK [All] menu. Highlight
list1 and press Í to paste list1 in the x value field.
Note: If the contents of the MAIN folder are not displayed, highlight
the MAIN folder and then press B to expand it.
8. Press D to move the cursor to the y value field. Then press
2 ° to display the
VAR-LINK [All] menu again.
Highlight
list2 and press Í to paste list2 in the y value
field.
9. Press D to move the cursor to the Use Freq and Categories?
field. If
NO is not displayed, press B and set Use Freq and
Categories?
to NO.
10. Press Í to close the dialog box with changes saved.
Plot1 is selected.
Tip: The ¸ key evaluates an expression, executes an instruction, or
selects a menu item. When using the input examples in this guidebook
you may need to press ¸ more than once in order to calculate the
results. Press ¸ once to save your information, and then press ¸
again to close a dialog box.

 Loading...


