TI-89 / TI-92 Plus / Voyage™ 200 PLT Statistics with List Editor App „ Plots Menu 37
Plot Setup
Example
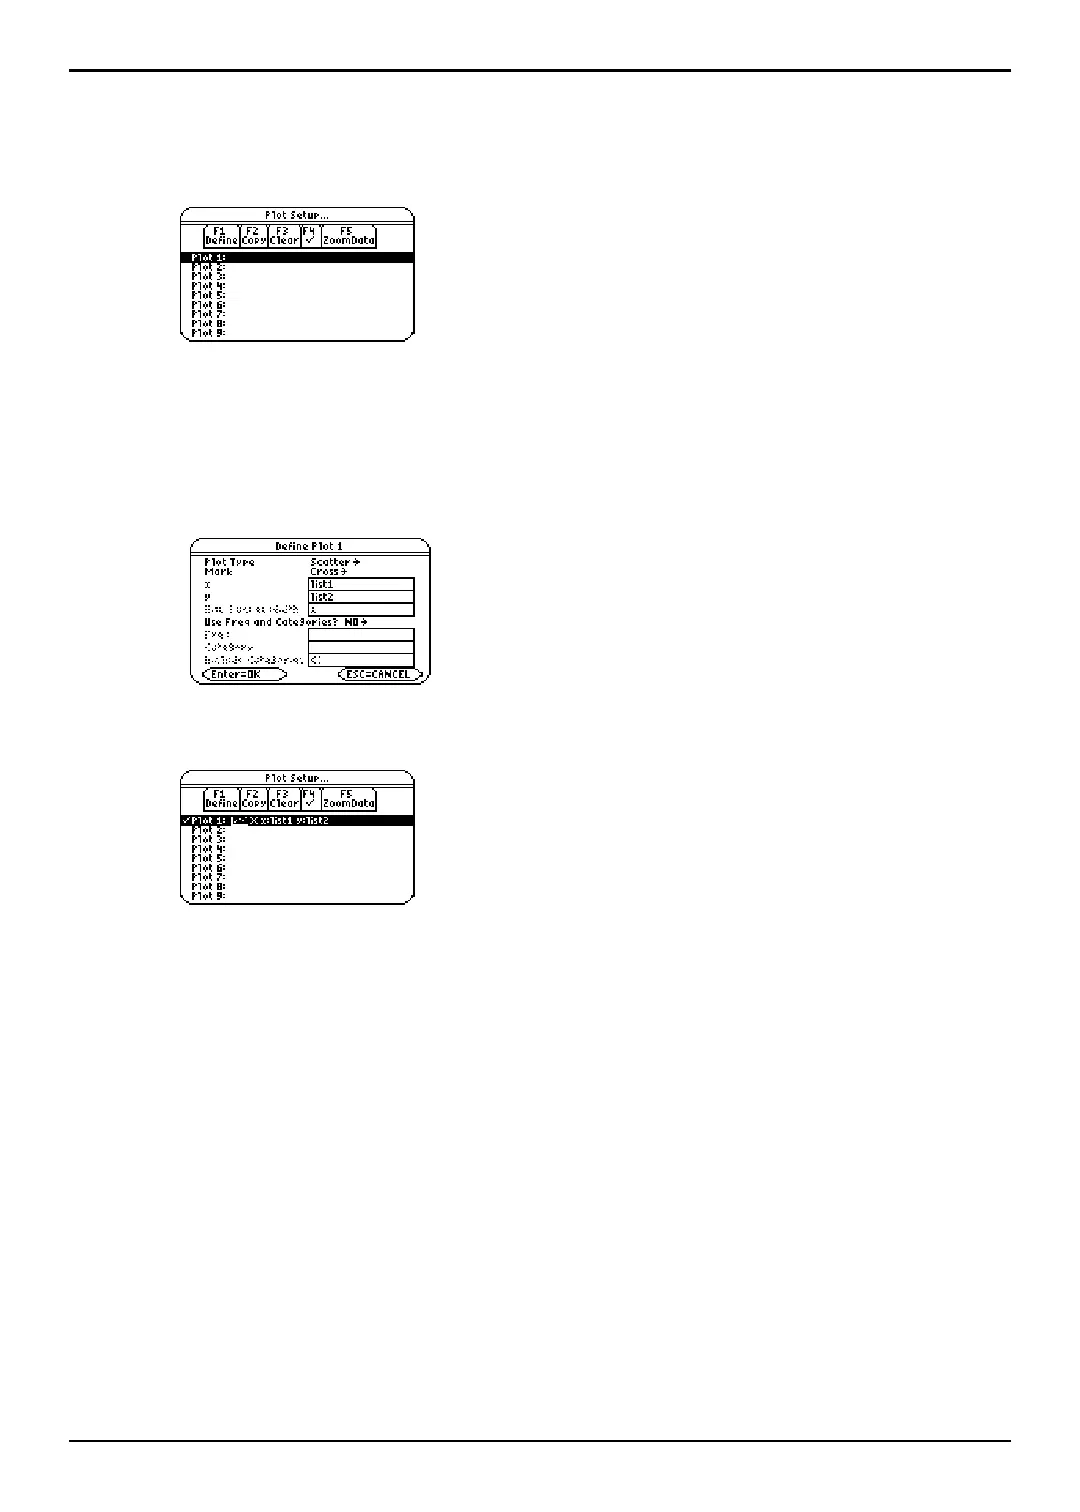
1. Press „ (Plots) and select 1:Plot Setup to display the Plot Setup dialog box. Initially,
none of the plots are defined. However, current plot definitions may be displayed.
2. Highlight the plot number that you want to define, and then press ƒ (Define) to
define the plot.
Note: On the calculator, items are active only if they are valid for the current settings of Plot Type
and Use Freq and Categories?
3. Specify applicable settings for the active items.
Note: The Stats/List Editor lets you paste a list into either
the X value or Y value field. Press 2 °, highlight
a list, and then press ¸ to paste a list name into the
field.
4. Press ¸. The
Plot Setup screen is redisplayed, and the plot you defined is
automatically selected for graphing.
Note: The Stats/List Editor displays the ‡(ZoomData) in the Plot Setup menu. Selecting
‡ (ZoomData) lets you set the viewing window to display all statistical data points without having
to access this function in the Y= Editor, Window Editor, or Graph Screen.

 Loading...


