TI-89 / TI-92 Plus / Voyage™ 200 PLT Statistics with List Editor App Getting Started 11
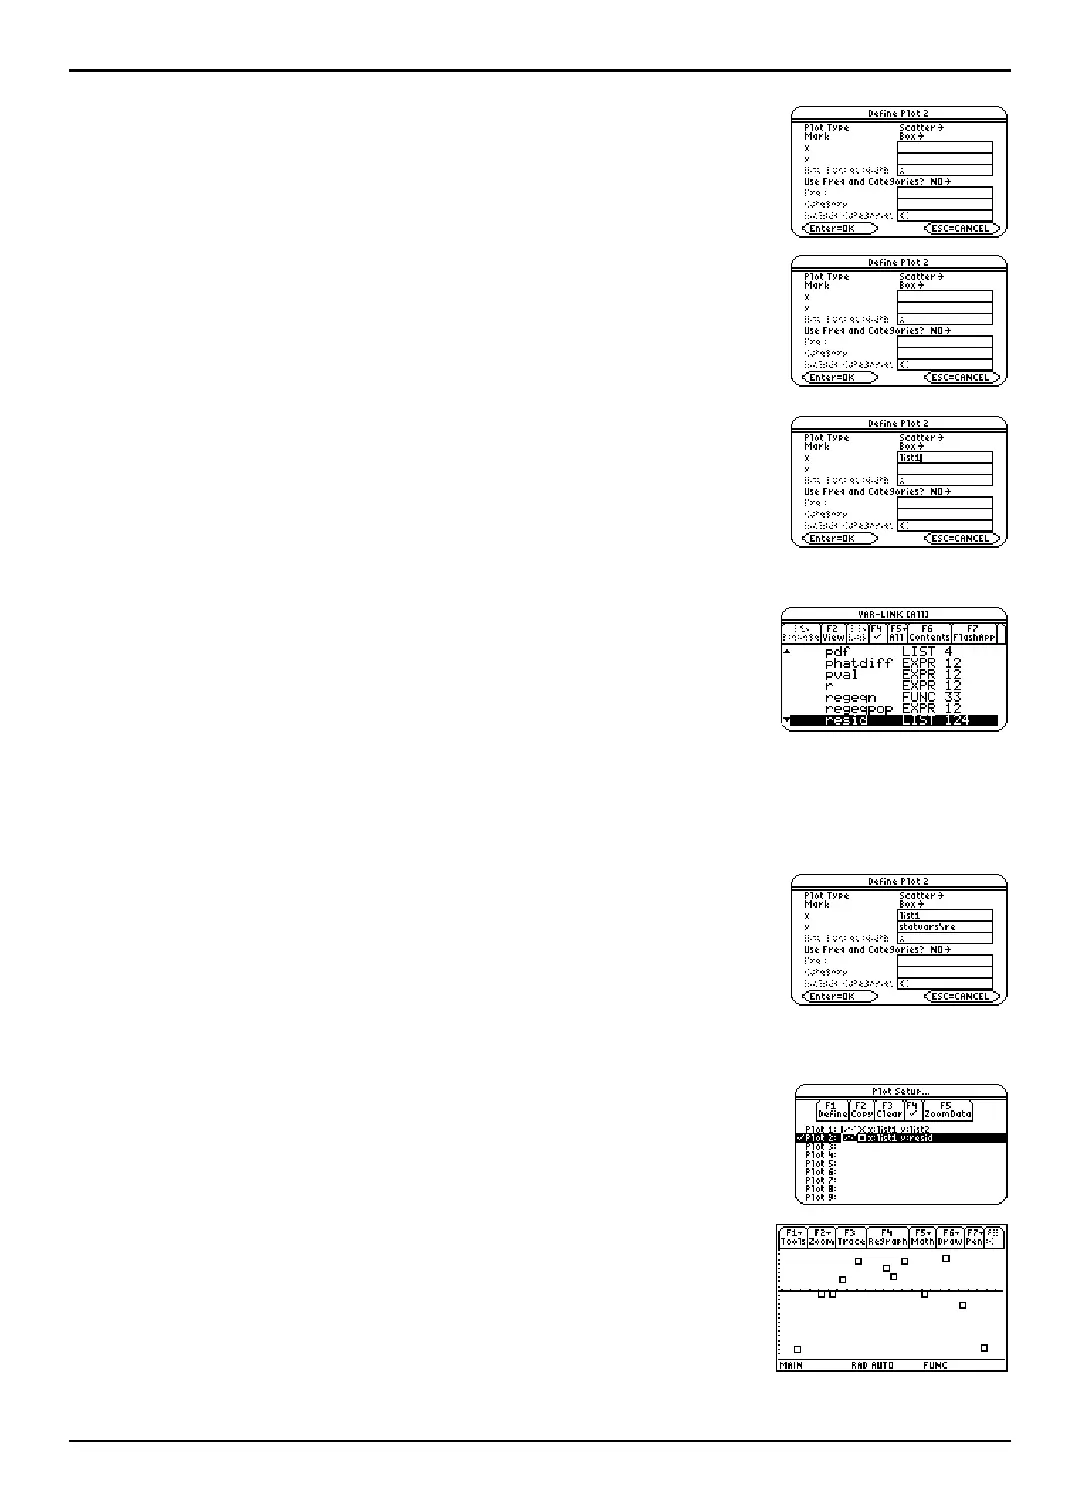
Example: Producing a Scatter Plot of the Residuals (
continued)
7. Highlight Plot2 and press ƒ (Define). The Define Plot 2 dialog
box is displayed.
8. If Scatter is not already selected, press B and select
1:Scatter.
9. Press D. If Box is not already selected, press B and select
1:Box to use the Box (è) mark for each data point on the
scatter plot.
10. Press D to move the cursor to the x field. Press 2
° to display the
VAR-LINK [All] menu. Highlight list1
(in the MAIN folder) and press Í to specify list1 for the
x value field.
Note: If the contents of the MAIN folder are not displayed, highlight
the MAIN folder, and then press B to expand it.
11. Press D to move the cursor to the y field. Press 2
° to display the
VAR-LINK [All] menu. Highlight the
resid list variable (in the STATVARS folder).
Tip: If the MAIN folder is expanded, highlight MAIN, and then press
A to collapse the folder. You then have easy access to the
STATVARS folder. Additionally, you can type a letter to scroll
through a list. If there are any variable names that start with that
letter, the cursor moves to highlight the first of those variable
names.
12. Press Í to specify the statvars/resid variable for the y
field.
Note: If you paste a variable name that is not in the current folder,
the variable’s pathname is pasted as well.
13. If necessary, press D and set the Use Freq and Categories?
option to NO.
14. Press Í to close the dialog box with the changes saved.
Plot2 is selected.
15. Press ‡ (ZoomData). The window variables are adjusted
automatically and
Plot2 is displayed.
This is a scatter plot of the residuals.

 Loading...


