TI-89 / TI-92 Plus / Voyage™ 200 PLT Statistics with List Editor App † Calc Menu 72
1-Var Stats (
continued)
Outputs Stored to Description
v x_bar Mean of x values.
Gx sumx Sum of x values.
Gx
2
sumx2 Sum of x
2
values.
Sx sx_ Sample standard deviation of x.
sx sx Population standard deviation of x.
n n Number of data points.
MinX min_x Minimum of x values.
Q1X q1_x 1st Quartile of x.
MedX med_x Median of x.
Q3X q3_x 3rd Quartile of x.
MaxX max_x Maximum of x values.
G(x-v)
2
ssdevx Sum of squares of deviations from the mean of x.
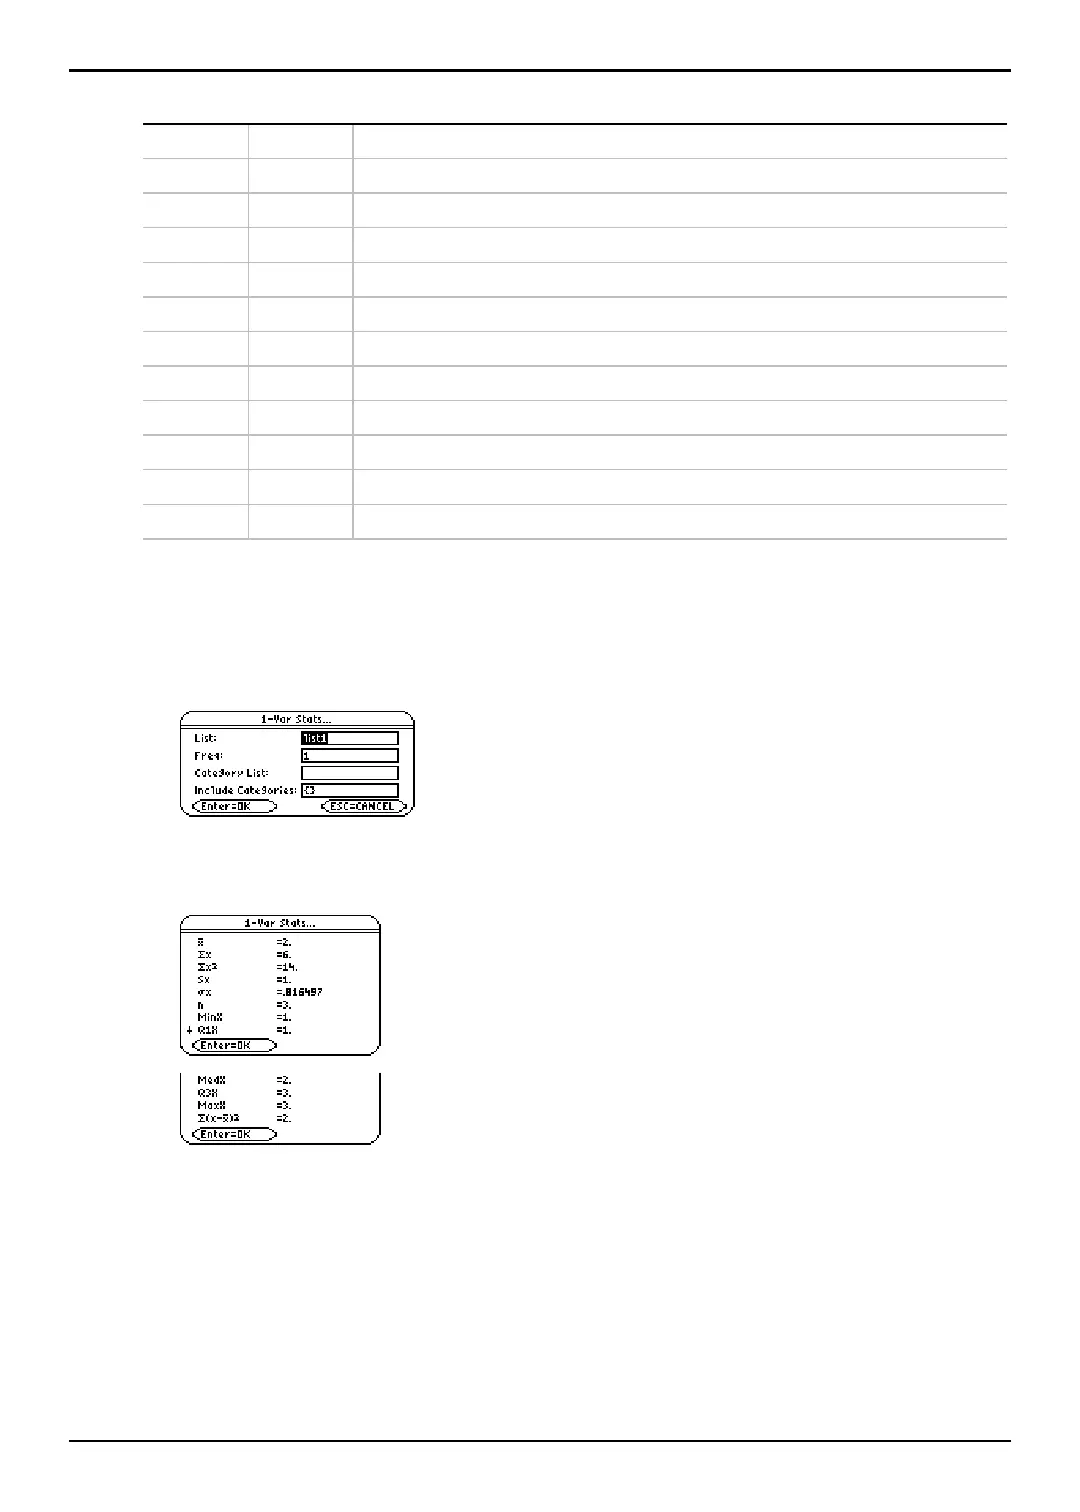
Example
1. In the list editor, enter: list1={1,2,3}
2. Press † (Calc) and select 1:1-Var Stats to display the 1-Var Stats input dialog box.
Enter the arguments as shown below.
Tip: You can press 2 °
, highlight a list, and then
press ¸ to paste the list name into the list editor. Be
sure to close arguments with a right parenthesis (d).
You can also press … (List) and select 1:Names to
display the VAR-LINK [All] menu.
3. Press b to compute the data.

 Loading...


