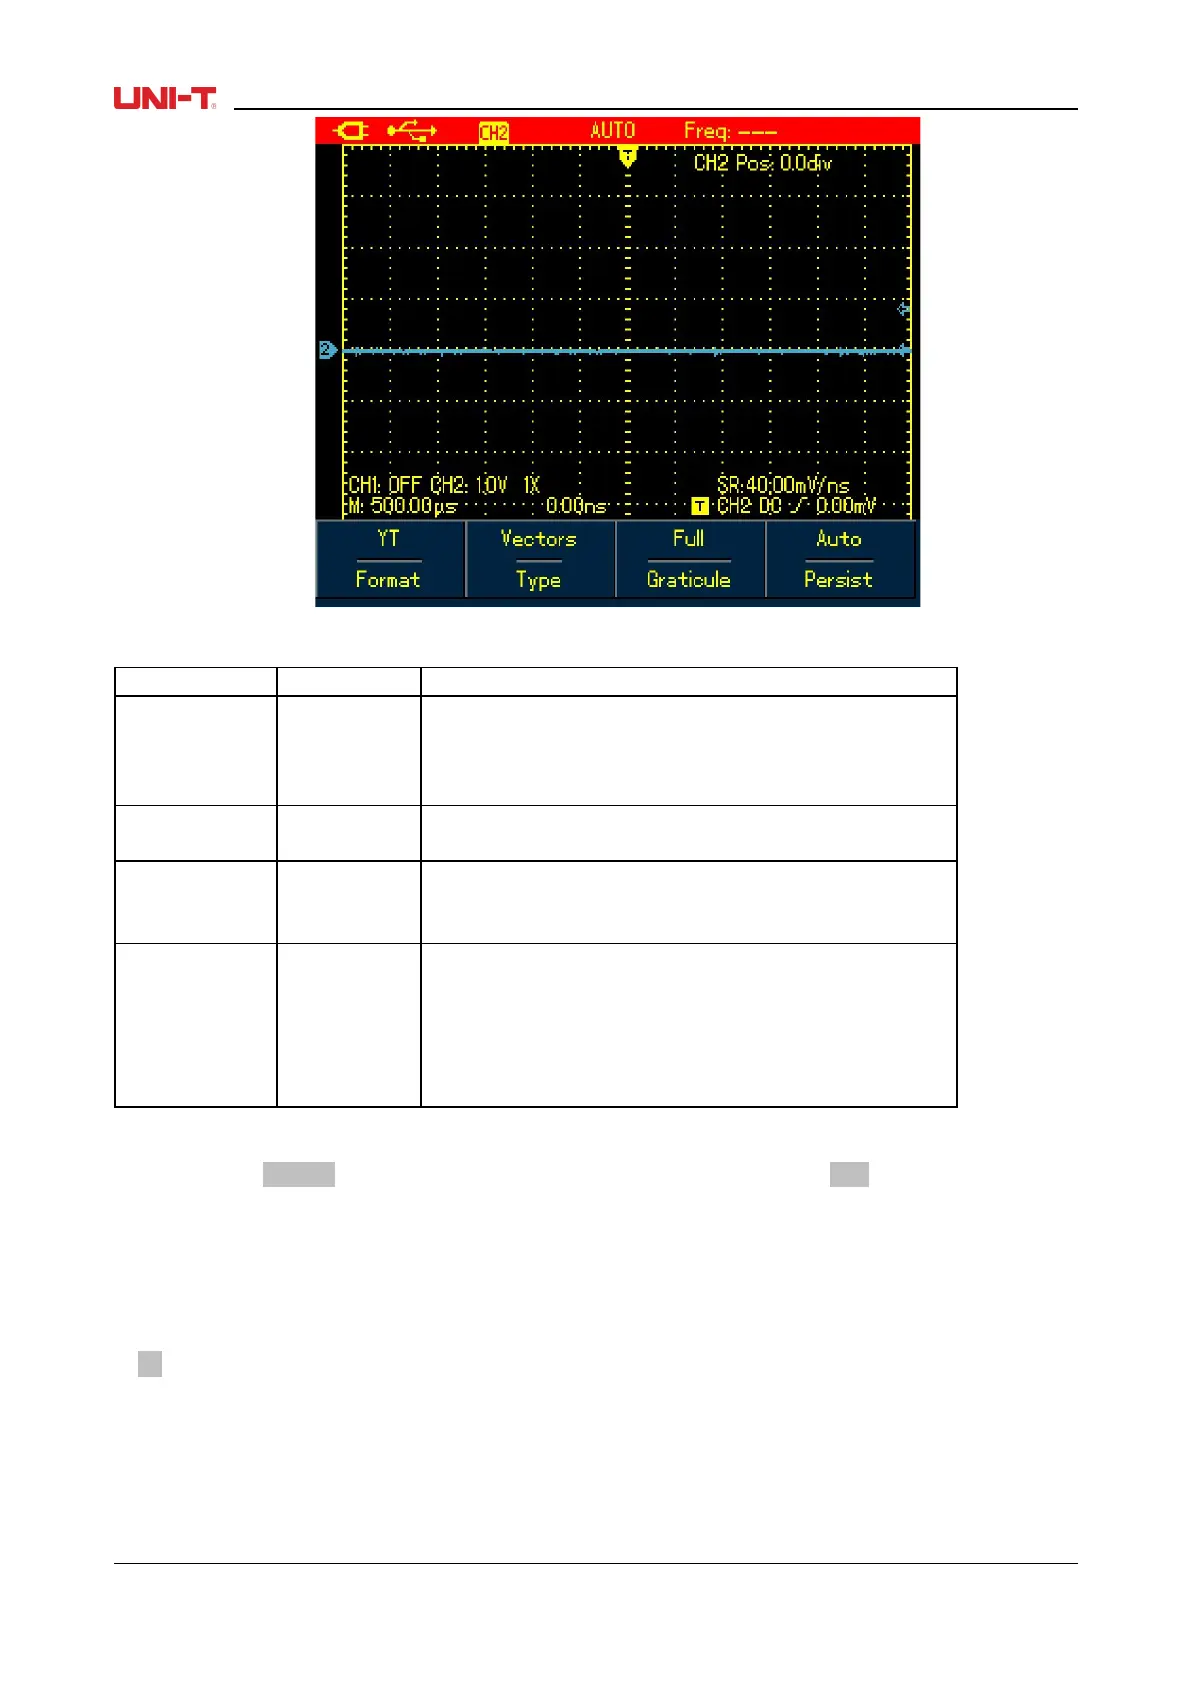
Figure 6-14 Waveform Display Setup
Table 6-9
To display relationship between voltage(vertical) and
time(Horizontal).
X-Y display mode using CH1 signal to form X axis and CH2
signal for Y axis(applicable only for dual channel model)
Connect sample dots and display.
Directly display sample dots
To set the graticule of waveform display zone to Full,
Grid and Cross Hair mode
Update the waveforms at normal rate.
Update after waveform data is hold for 1 second.
Update after waveform data is hold for 3 seconds.
Update after waveform data is hold for 5 seconds,
Waveform data is kept on the screen, new data, if any,
could be added into the display continuously.
Term Explanation:
Display Format: VECTOR Display fills out all blanks between neighboring points, DOT Display just shows
sample points.
Update Rate: The times that the oscilloscope updates the waveforms per second. it reflect how fast the
Oscilloscope could allow you to observe signal dynamic change.
Y-T Mode: In this mode, Y axis represents voltage and X axis for the time.
Slow Scan Mode: When the timebase is set at 50ms/div or lower, the Oscilloscope will enter into slow scan
mode. This mode is applied to observe low-frequency signal. It is recommended that channel coupling is set
to DC.
6.7 Setting Auto Measurements
The section below introduces in details the powerful auto measurement function owned by the
Oscilloscope. Press MEASURE button to open auto measurement menu, see the table below:
54 UTD1000L User Manual
 Loading...