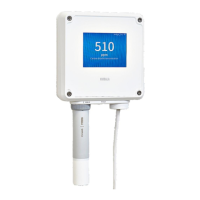
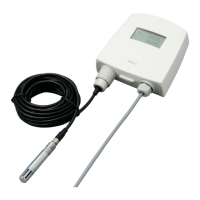
2.3.1 Graph mode
Figure 4 Indigo300 display, graph mode
1 Graph time scale. Shows the latest
10 minutes by default.
You can set the transmitter display to show the connected probe's measurement data as
graphs.
The measurement parameters and the graph time scale can be configured with the Insight PC
software or Indigo80 handheld indicator.
You can switch between the dierent display views with the push button on the
front of the transmitter.
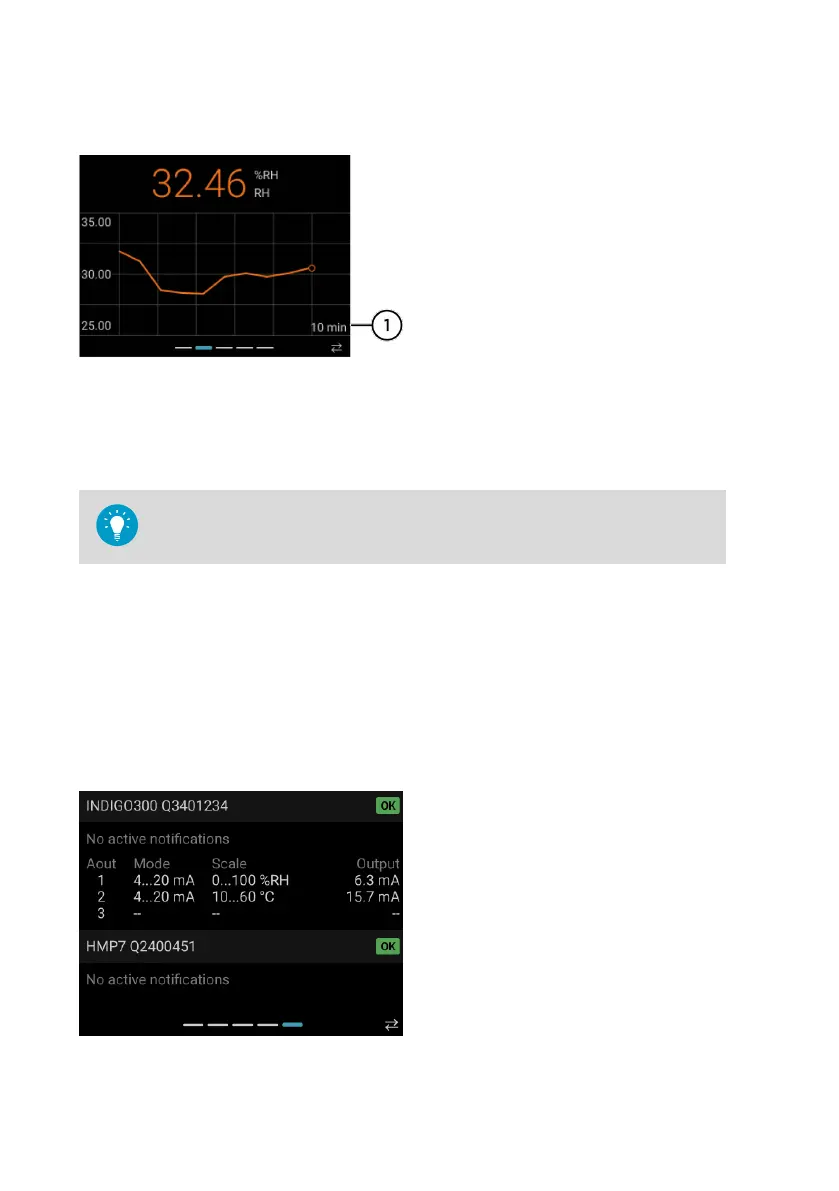
2.3.2 Device status mode
The rightmost display view shows the status of the transmitter and the connected probe. Any
active notifications, for example, about the probe's calibration having expired, are shown. In
addition, the view shows the mode, scaling, and output value of the transmitter's analog
outputs.
To navigate to the device status view, press the push button on the front of the transmitter
repeatedly. The view is shown for 1 minute, after which the display automatically reverts to the
numeric view.
Figure 5 Indigo300 display, device status
mode
Indigo300 User Guide M212849EN-A
12

 Loading...