6-22
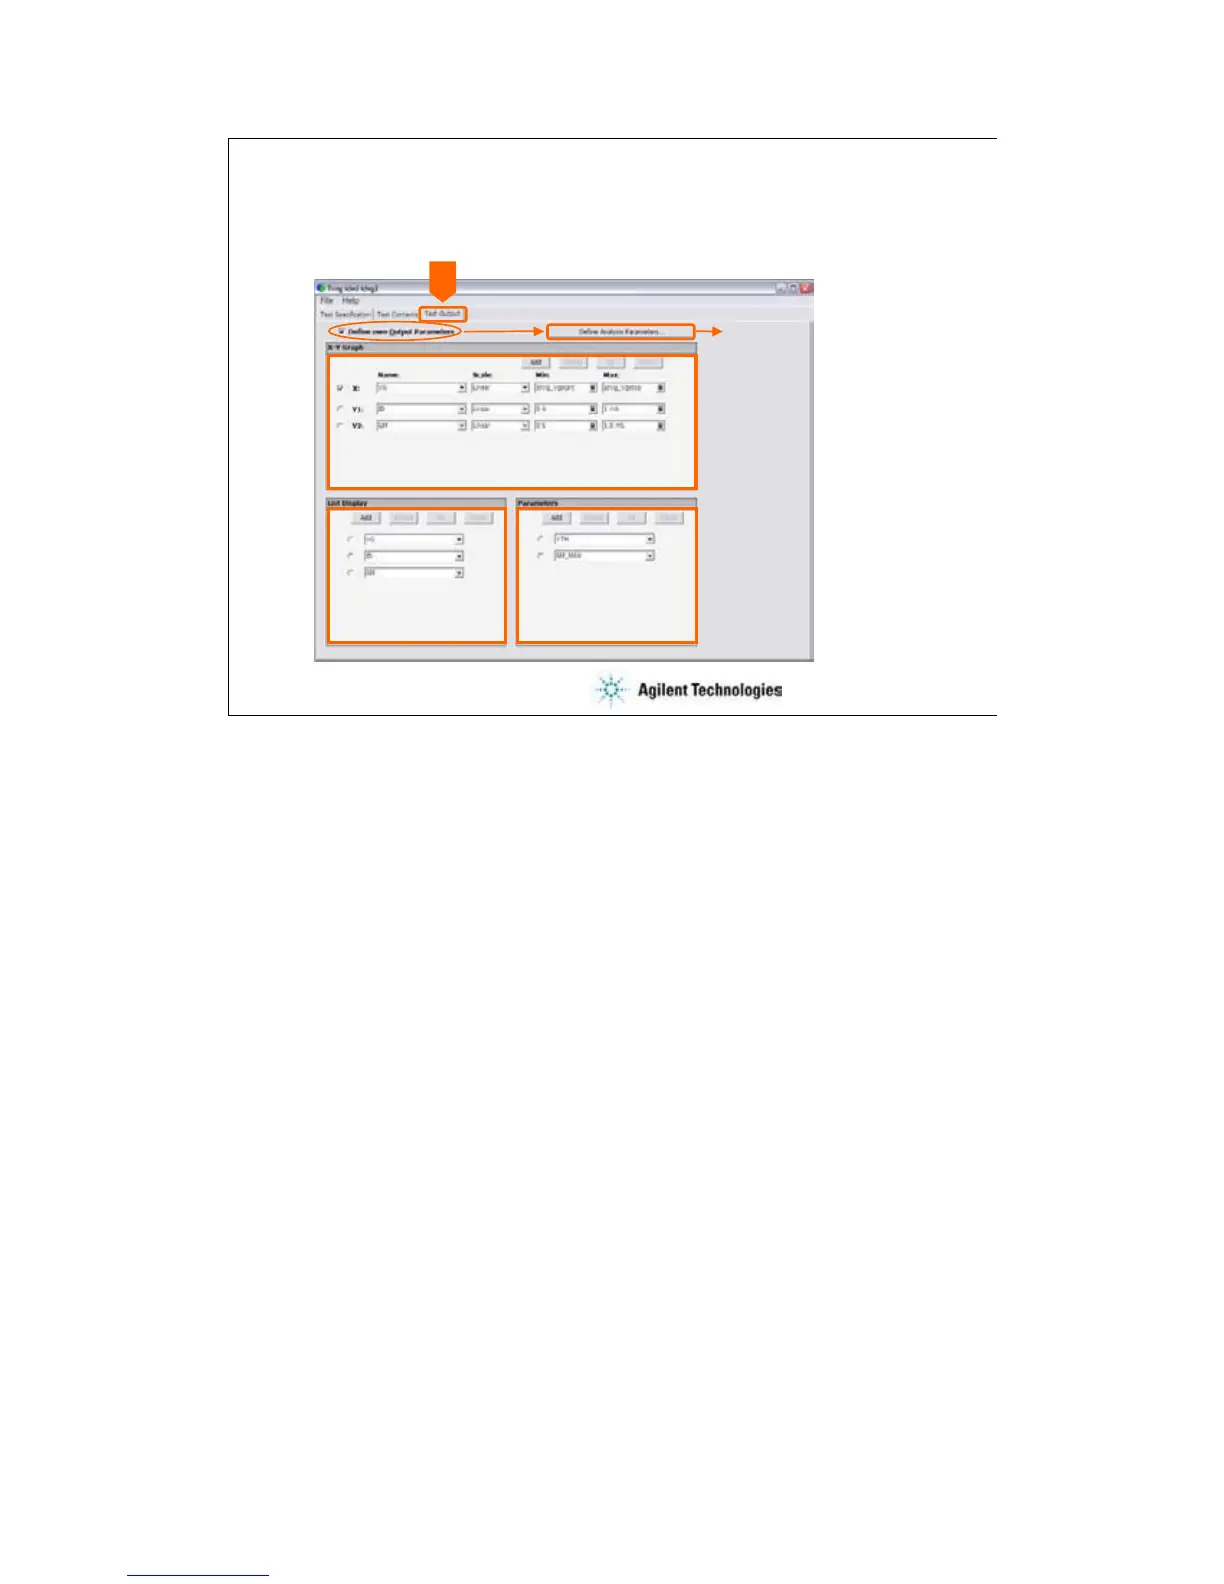
Defining Test Output
Specify X axis and Y axis
Select variables to list
Opens Analysis Parameter
Definition window
(see next slide).
Select parameters
to display
1. Define analysis parameters.
2. Set display parameters.
The test output setup is optional. If you need the test result output (test result display and
record) for this application test, declare the variables (analysis parameters) and define the display
setup.
At first, declare the analysis parameters:
•Check the Define own Output Parameters box.
•Click the Define Analysis Parameters… button. The Analysis Parameter Definition window is
opened.
•Declare the analysis parameters. See next slide.
•Click the Close button.
•Set the display parameters. See below.
The X-Y Graph area is used to set the X axis and Y axis of the X-Y Graph Plot area on the Data
Display window.
•Name: Name of variable to plot on the X axis
•Scale: Linear or Log
•Min: Minimum value of the specified axis
•Max: Maximum value of the specified axis
The List Display area selects the variables to be listed on the List Display area of the Data Display
window. Up to 20 variables can be set.
The Parameters area selects the variables to be listed on the Parameters area of the Data Display
window. Up to 20 parameters can be set.
 Loading...