4 Basic Operation
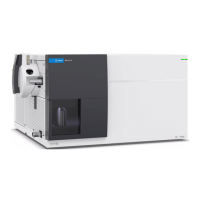
Chromatogram Plot window
Agilent Triple Quadrupole LC/MS System User Guide 66
Chromatogram Plot window
This window displays the chromatogram plots in real time. These plots can be
user-defined signals and/or instrument parameters.
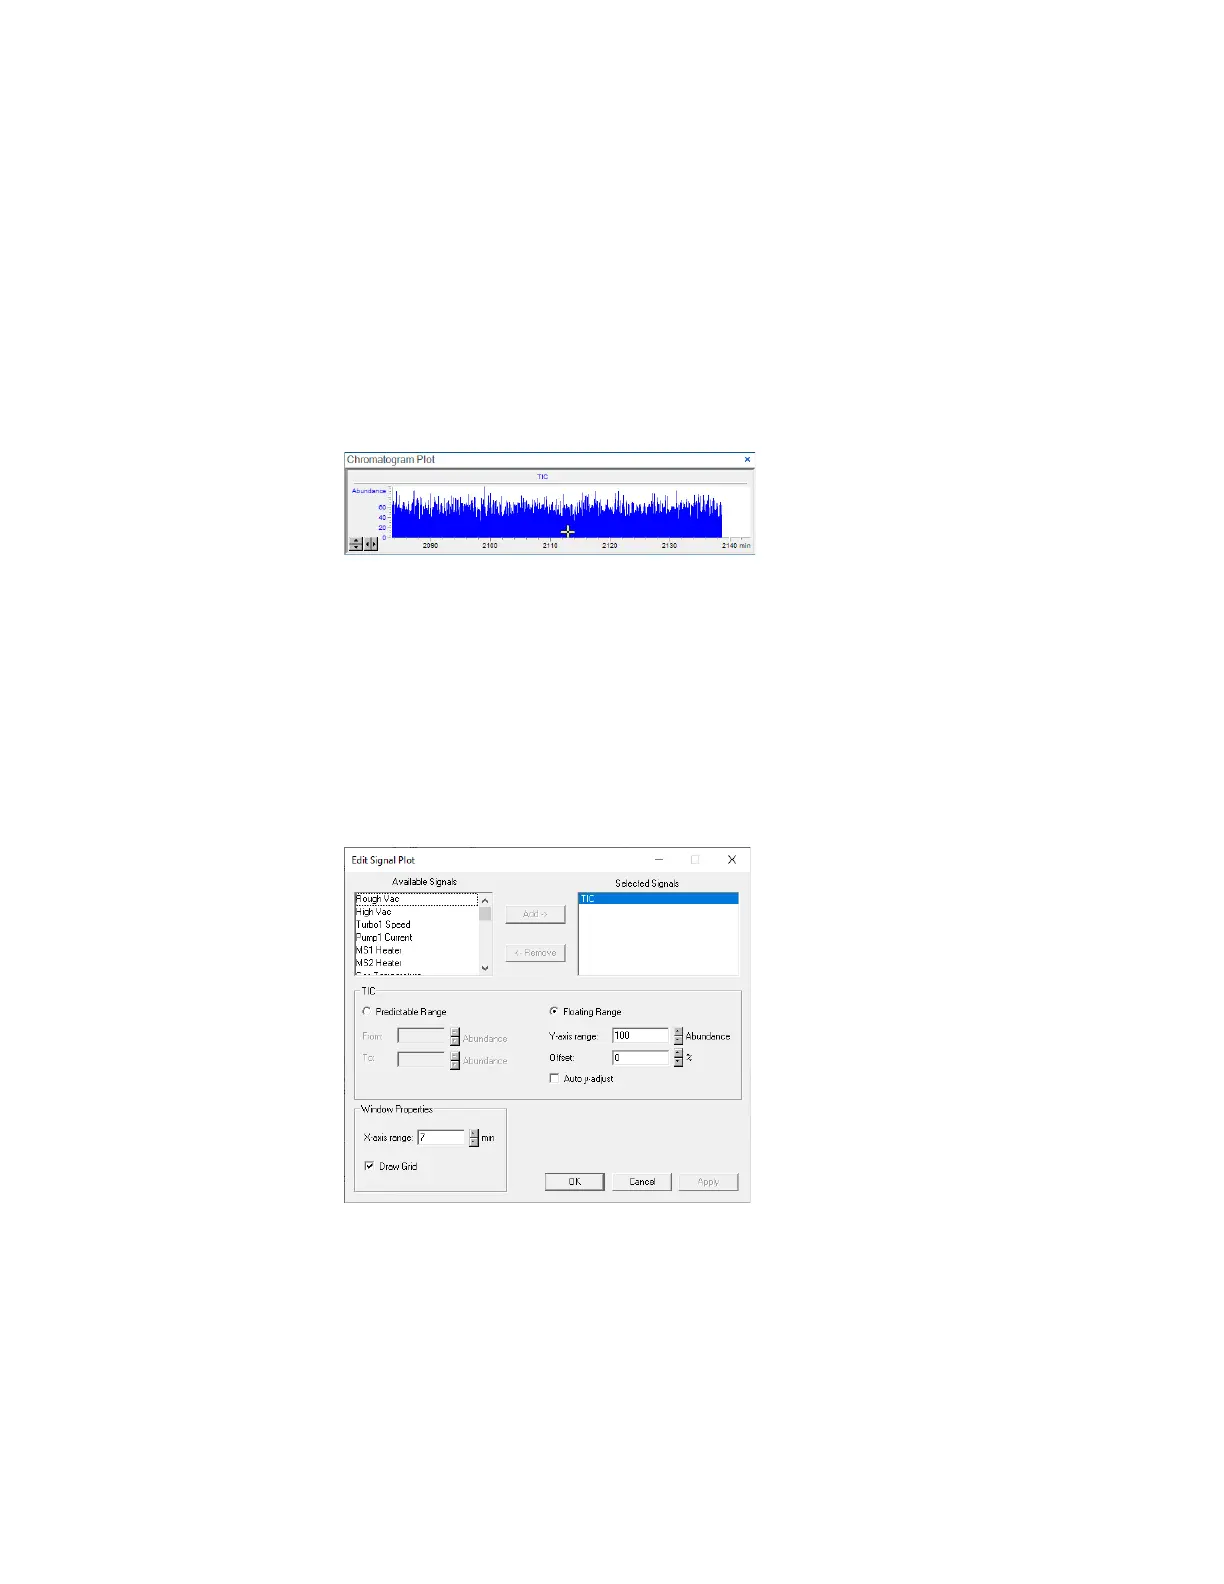
Monitoring baseline and adjusting plot
The Edit Signal Plot dialog allows the selection of various instrument parameters
and signals for display in the Chromatogram Plot window. The signals and their
display characteristics can be adjusted as described in this section. The
customizations made to the plot remain, even when the Acquisition software is
closed and reopened.
1 In the Chromatogram Plot window, right-click the Chromatogram Plot
window, and select Change. The Edit Signal Plot dialog box opens.
2 Select the signal to monitor and set the X and Y range for the plot.
 Loading...