PAGE 27
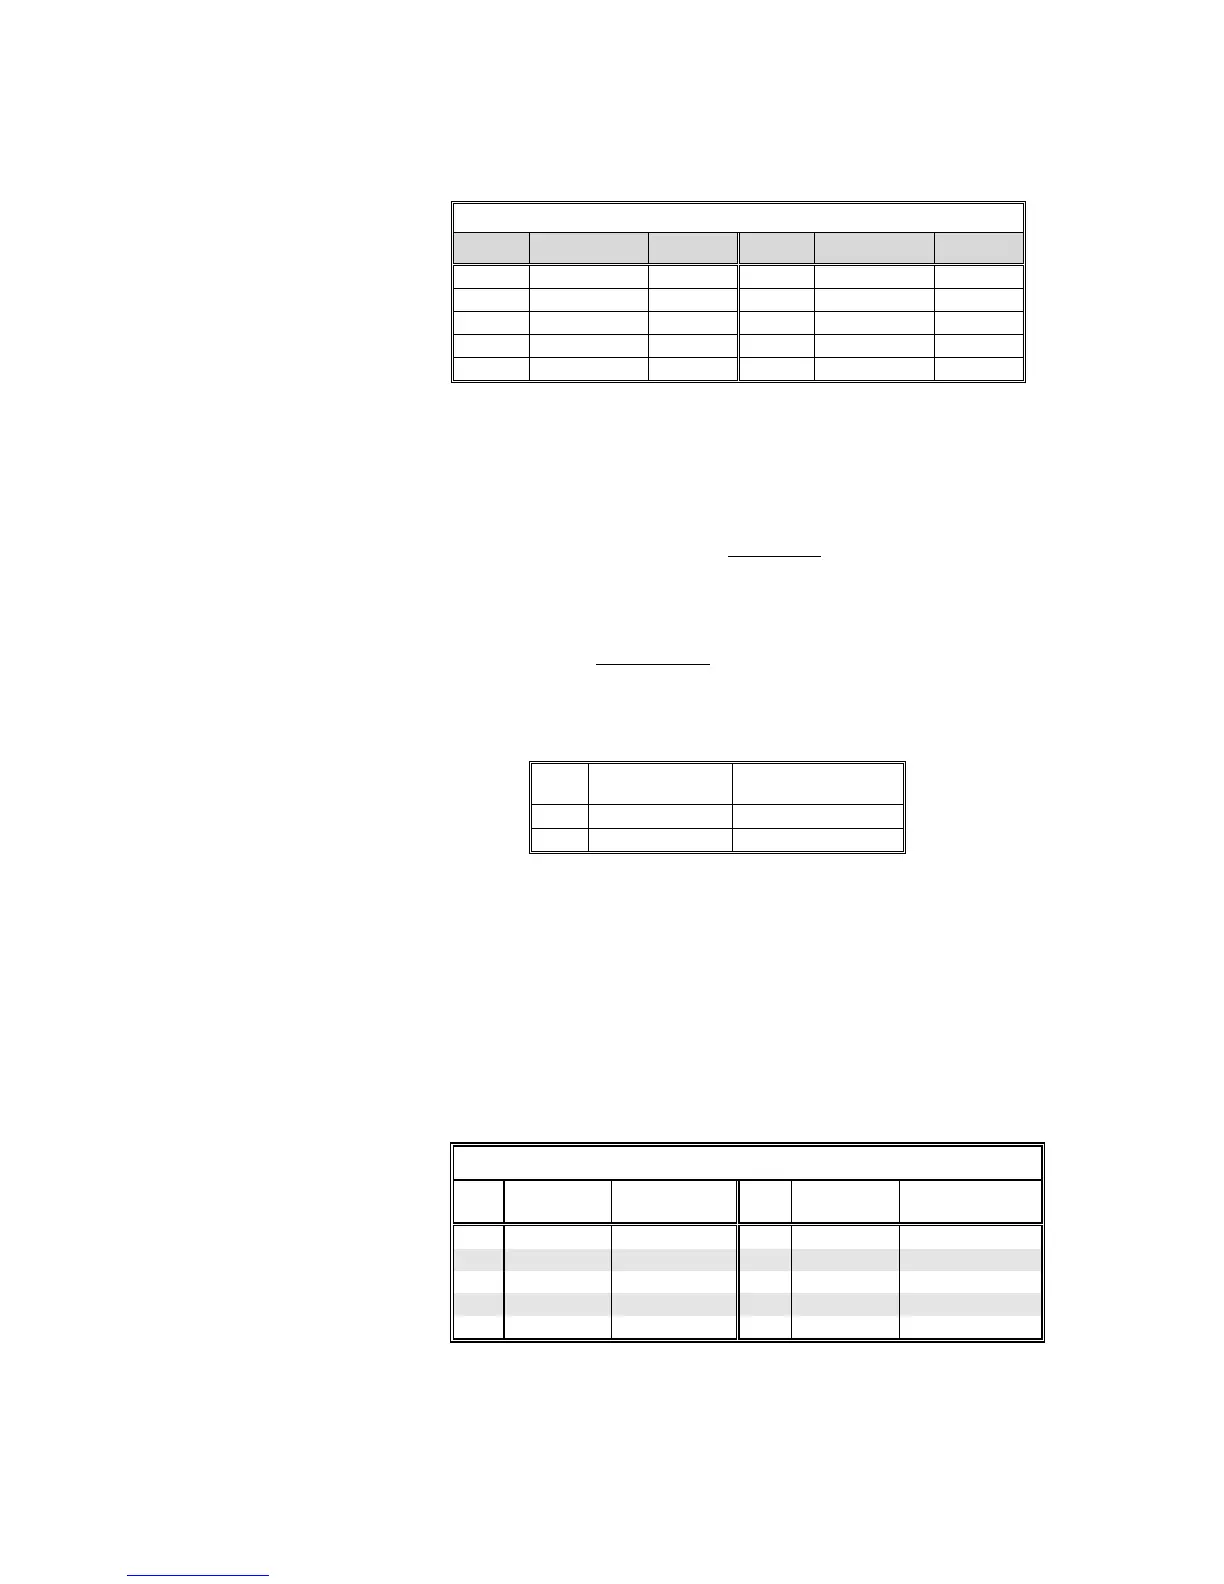
TABLE A -- BUILT-IN Chemical Concentration Tables
Solution Concentration
°C Range
Solution Concentration
°C Range
NaOH 0-16%
0-100°C
H
2
SO
4
40-80%
0-115°C
CaCl
2
0-22%
15-55°C
H
2
SO
4
93-99%
0-115°C
HNO
3
0-28%
0-50°C
H
3
PO
4
0-40%
0-75°C
HNO
3
36-96%
0-50°C
HCl 0-18%
0-65°C
H
2
SO
4
0-30%
0-115°C
HCl 22-36%
0-65°C
Creating USER-DEFINED Concentration TABLE
If the solution being measured does not match any BUILT-IN chemical table, create a USER-
DEFINED table to convert measured conductivity into displayed % concentration.
NOTE: A USER-DEFINED table must contain
at least two data points (Pt. 1 and Pt. 2) but can
have up to ten. (More points improve measuring accuracy.) Each point must have a
conductivity value coordinate (shown as X) and a corresponding % concentration
value coordinate (shown as Y). The conductivity values and range are shown in units
selected by the “DISPLAY COND FORMAT” screen. Conductivity values for each
successive data point
must increase. Concentration values, shown in their selected
99.99% or 200.0% display format, must be different from each other and always
entered in order (increasing or decreasing). The table must be monotonic; that is, as
conductivity values increase, concentration values must always increase or decrease.
Data
Point
Conductivity Value
(X coordinate)
% Concentration Value
(Y coordinate)
Pt. 1 0 µS/cm 0.00%
Pt. 2 2000 µS/cm 99.99%
To create your own USER-DEFINED table, edit this default table and, if needed, add
more points.
Recommendation: Before entering values, plan ahead and determine the
conductivity and corresponding % concentration values for each data point in
your table. Use TABLE B to conveniently organize and note your specific table
entry values:
TABLE B -- Values for USER-DEFINED Concentration Table
Data
Point
Conductivity
Value
% Concentration
Value
Data
Point
Conductivity
Value
% Concentration
Value
Pt. 1 Pt. 6
Pt. 2 Pt. 7
Pt. 3 Pt. 8
Pt. 4 Pt. 9
Pt. 5 Pt. 10