PAGE 28
NOTE: If the transmitter is calibrated, you can use the uncompensated conductivity
MEASURE screen to determine corresponding conductivity values.
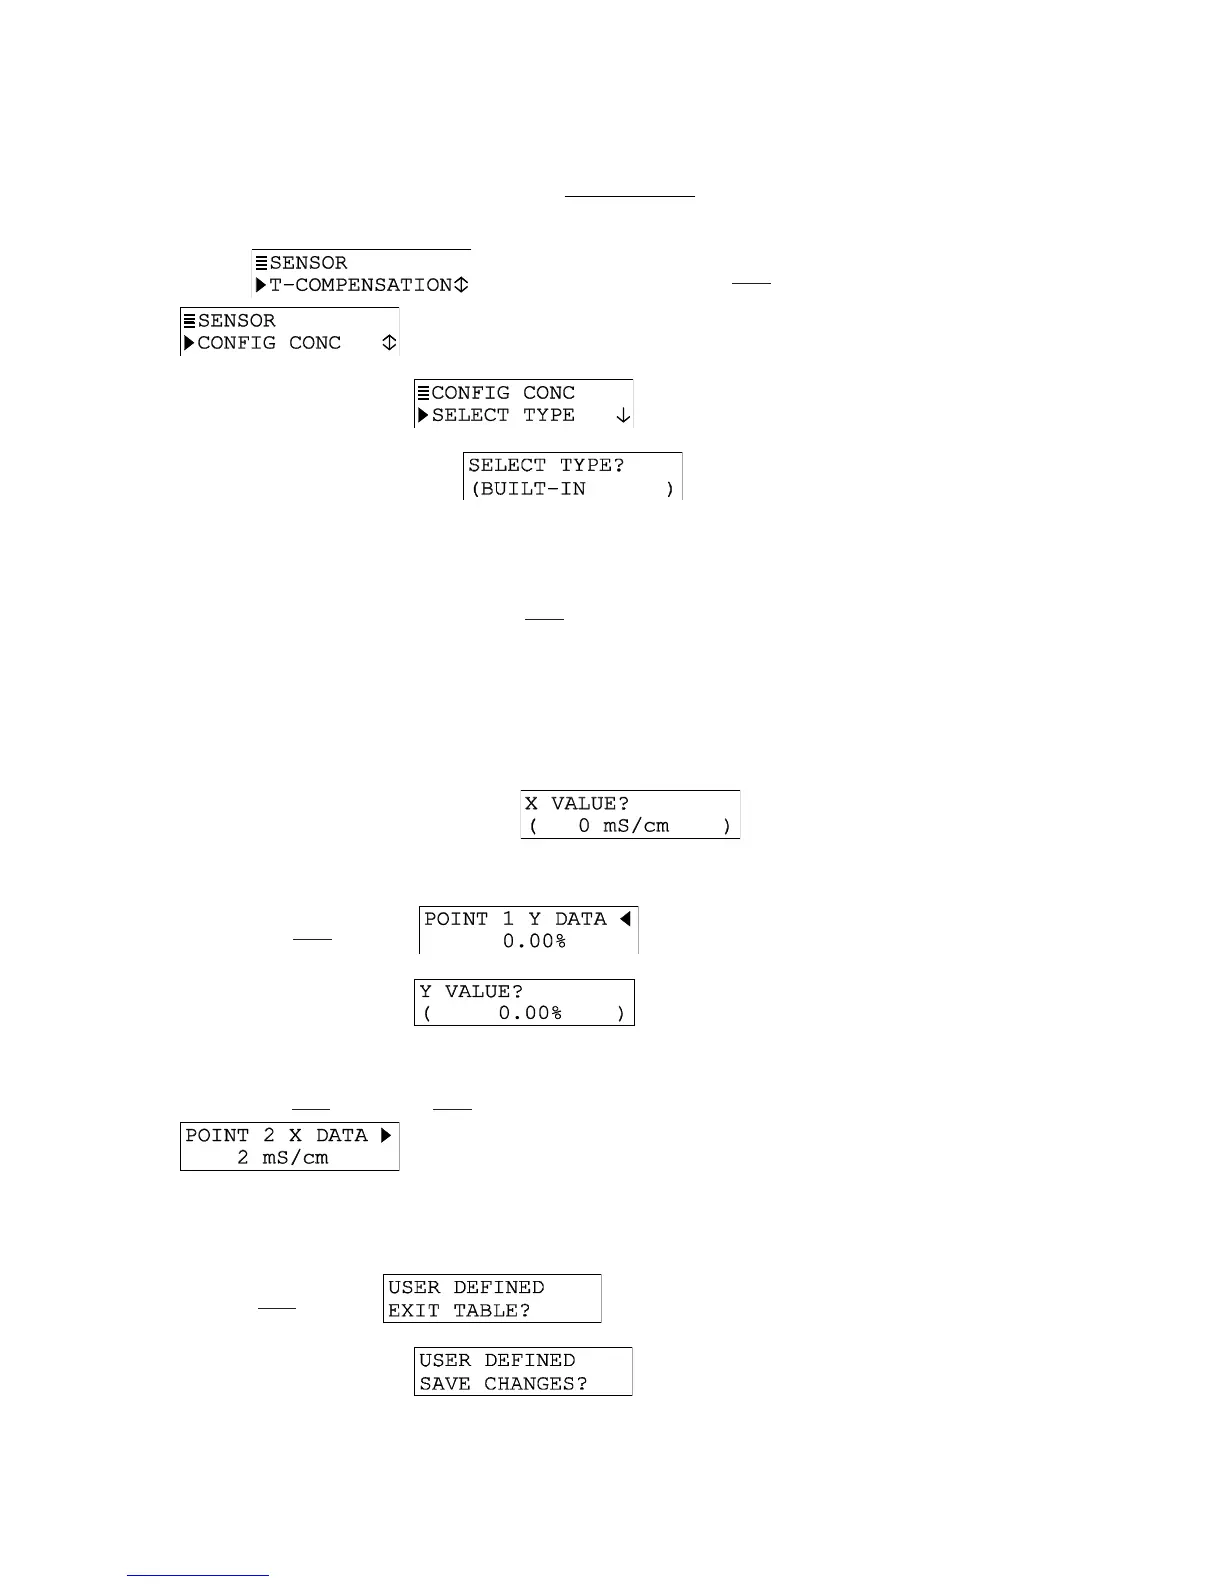
1. With the
screen displayed, press
ØØ
ØØ
Ø key once to display
.
2. Press ENTER key to display
.
3. Press ENTER key again to display
. Use
ØØ
ØØ
Ø or
××
××
× key to
select “USER-DEFINED,” which configures the transmitter to use the special concentra-
tion table you create.
4. With “USER-DEFINED” displayed, press ENTER key.
5. After the screen re-appears, press
ØØ
ØØ
Ø key once to display .
6. Press ENTER key to display a screen like . Using this screen and other similar data
point screens, enter data to create your table:
NOTE: To switch between X and Y coordinate screens of a data point, use
ÕÕ
ÕÕ
Õ
and
ÖÖ
ÖÖ
Ö
keys. To move between data points of an X or Y coordinate, use
ØØ
ØØ
Ø
and
××
××
×
keys.
A. Press ENTER key to display a screen like
. Use arrow
keys to adjust the Point 1 conductivity value to an appropriate value, and press ENTER
key to enter it.
B. Press
ÖÖ
ÖÖ
Ö key once to display .
C. Press ENTER key to display
. Use arrow keys to adjust
the Point 1 % concentration value to correspond with the Point 1 conductivity value,
and press ENTER key to enter it.
D. Press
ØØ
ØØ
Ø key once and
ÕÕ
ÕÕ
Õ key once to display a screen like
.
E. Repeat steps 6A through 6D to enter the conductivity and corresponding % concentra-
tion values for each remaining data point in the table.
F. After all X and Y coordinate values are entered for each data point in the table, press
ESC key once to display .
G. Press ENTER key to display
.
H. Press ENTER key again to save the table.