EMF (Option 444) 9-4 Measurement Results
Spectrum Analyzer MG PN: 10580-00349 Rev. H 9-5
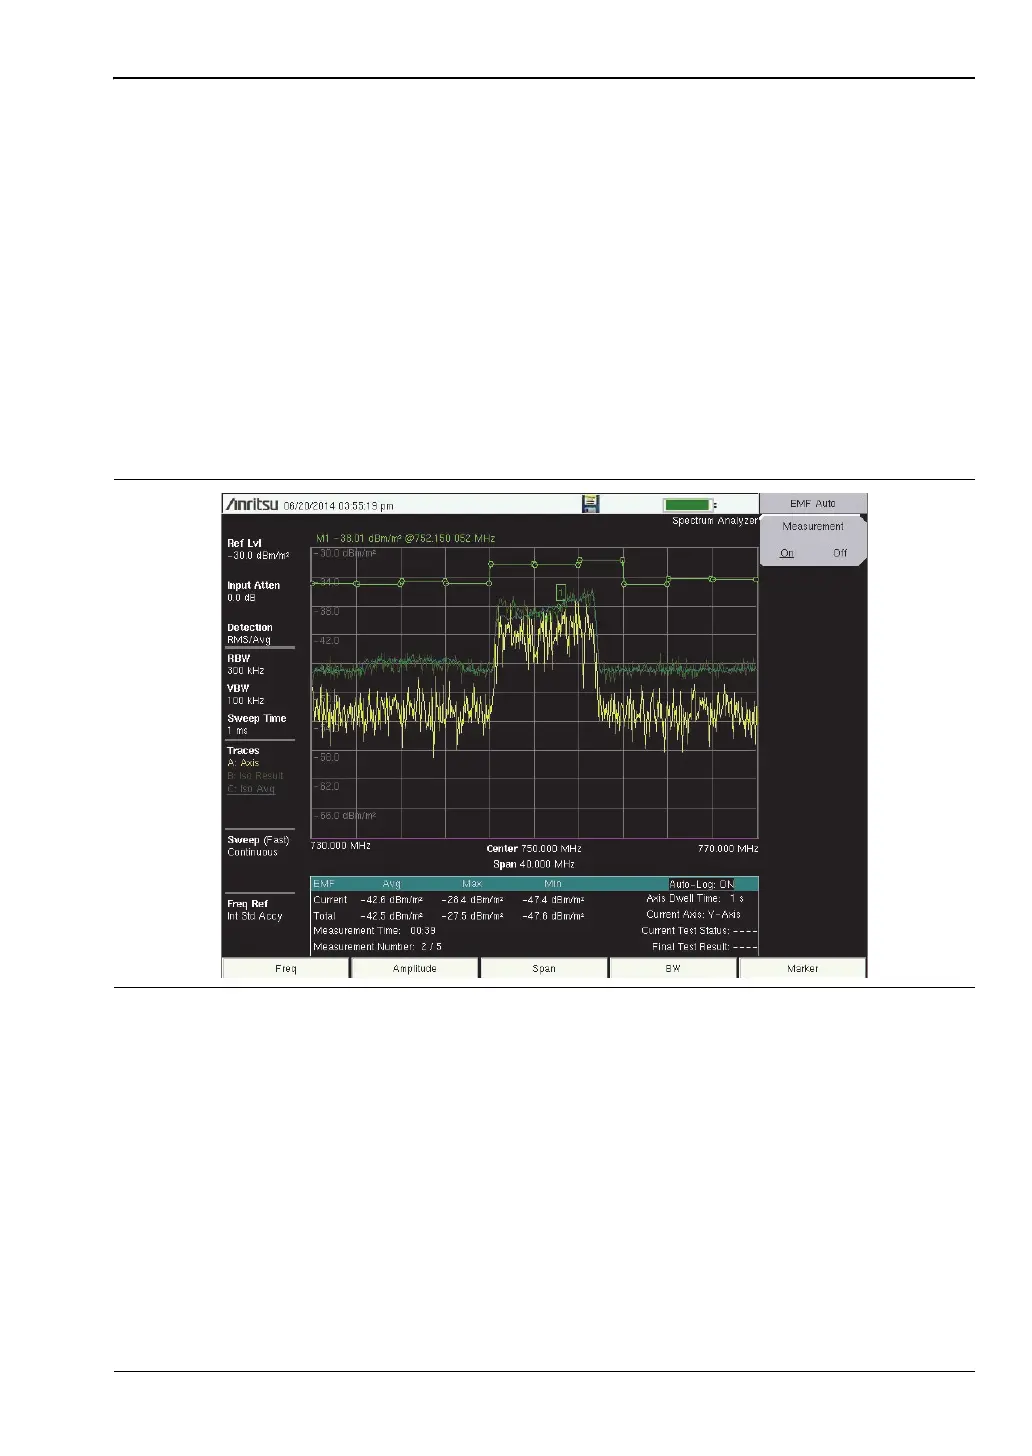
9-4 Measurement Results
After completing the data collection for the three axes, the Isotropic Result is calculated and
displayed. In addition to the three traces displayed on the user interface (Axis Sweep Data,
Current Isotropic Result, and Average Isotropic Result/Measurement), the max, min, and
average values of the Isotropic Result traces are also computed and displayed in the table
below the graph region. See Figure 9-5. The average value is computed as:
sum of the 551 trace point amplitudes / 551
The Current row displays values computed for all measurements completed thus far, as
indicated by Measurement Number (2/5, for example) at the bottom of the table. At the end of
the specified measurement time, the current max, min, and average values are copied to the
Total row. The Current row is then cleared for the next measurement. The Isotropic Results
are updated until the set number of measurements have completed or you stop the
measurements by pressing the Measurement On/Off key.
Figure 9-5. EMF Measurement Display
ООО "Техэнком" Контрольно-измерительные приборы и оборудование www.tehencom.com
 Loading...