3-12 Measurements Menu W-CDMA/HSPA+ Signal Analyzer
3-34 PN: 10580-00234 Rev. T 3GPP MG
Demodulator Menu
Key Sequence: Measurements > Demodulator
CDP: Open the “CDP Menu” on page 3-35. When Code Domain Power
(CDP) is selected the screen displays all the selected OVSF codes and
selected OVSF zoom codes in the graphical format. The display also
displays P-CPICH Abs power, EVM, Carrier Frequency, Channel Power,
Carrier Feedthrough, Frequency Error in Hz and PPM, Noise Floor and Peak
CD Error. The screen also displays control channel view with CPICH,
P-CCPCH, S-CCPCH, PICH, P-SCH and S-SCH powers in the table format.
If the marker is set on the code, the marker will display the code number,
power and Symbol EVM.
Note: For the W-CDMA/HSPA+ demodulator option, the CDP screen
displays HSPA+ and W-CDMA signals. P-CPICH Abs power, EVM, Carrier
Frequency, Channel Power, Carrier Feedthrough, Frequency Error in Hz and
PPM, Noise Floor and Peak CD Error are also displayed. The screen
displays CPICH, P-CCPCH, S-CCPCH, PICH, P-SCH and S-SCH powers in
the table format. If the marker is set on the code, the marker will display the
code number, power and Symbol EVM.
CDP Table: Displays the following Code Domain Power (CDP) parameters
in table format: Code, Status, EVM, Mod Type, Power (dB), and Power
(dBm).
HSPA+: Open the “HSDPA Menu” on page 3-36. When HSPA+ is selected,
the screen displays all the selected OVSF including high speed data channel
codes and selected OVSF with high speed codes in the graphical format.
The selected code Power versus time and Constellation diagram will be
displayed. The screen also displays control channel view with P-CPICH Abs
power, EVM, Carrier Frequency, Channel Power, Carrier Feedthrough,
Frequency Error in Hz and PPM, Noise Floor and Peak CD Error. The
screen also displays CPICH, P-CCPCH, S-CCPCH, PICH, P-SCH and
S-SCH powers in table format.
Note: This screen is available with the W-CDMA/HSPA+ demod option only.
Codogram: Open the “Codogram Menu” on page 3-37. When Codogram is
selected the screen displays the changes in code power levels over time.
Two graphs are displayed on the screen, the top one displays all the
selected OVSF codes and the bottom one displays the selected OVSF zoom
codes.
Modulation Summary: Displays the demodulation parameters in the table
format.
Back: Returns to the “Measurements Menu” on page 3-30.
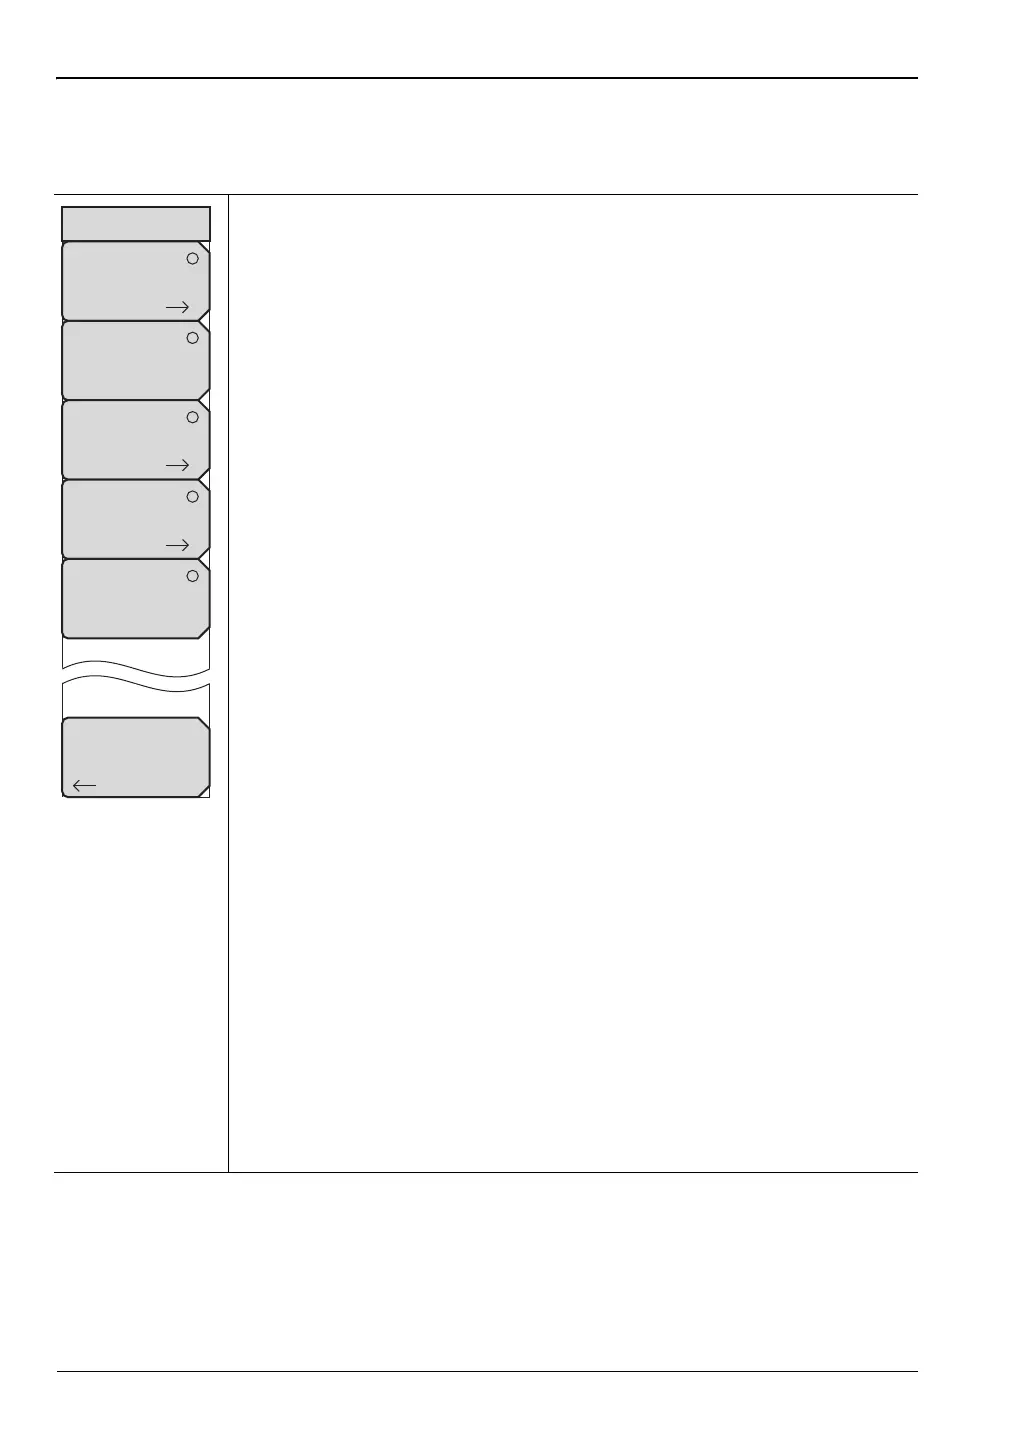
Figure 3-25. W-CDMA/HSPA+ Demodulator Menu
Demodulator
CDP
CDP
Table
HSDPA
Codogram
Modulation
Summary
Back
ООО "Техэнком" Контрольно-измерительные приборы и оборудование www.tehencom.com
 Loading...