8.
When the run is complete and the software displays the Analysis screen, conrm
the status of the run.
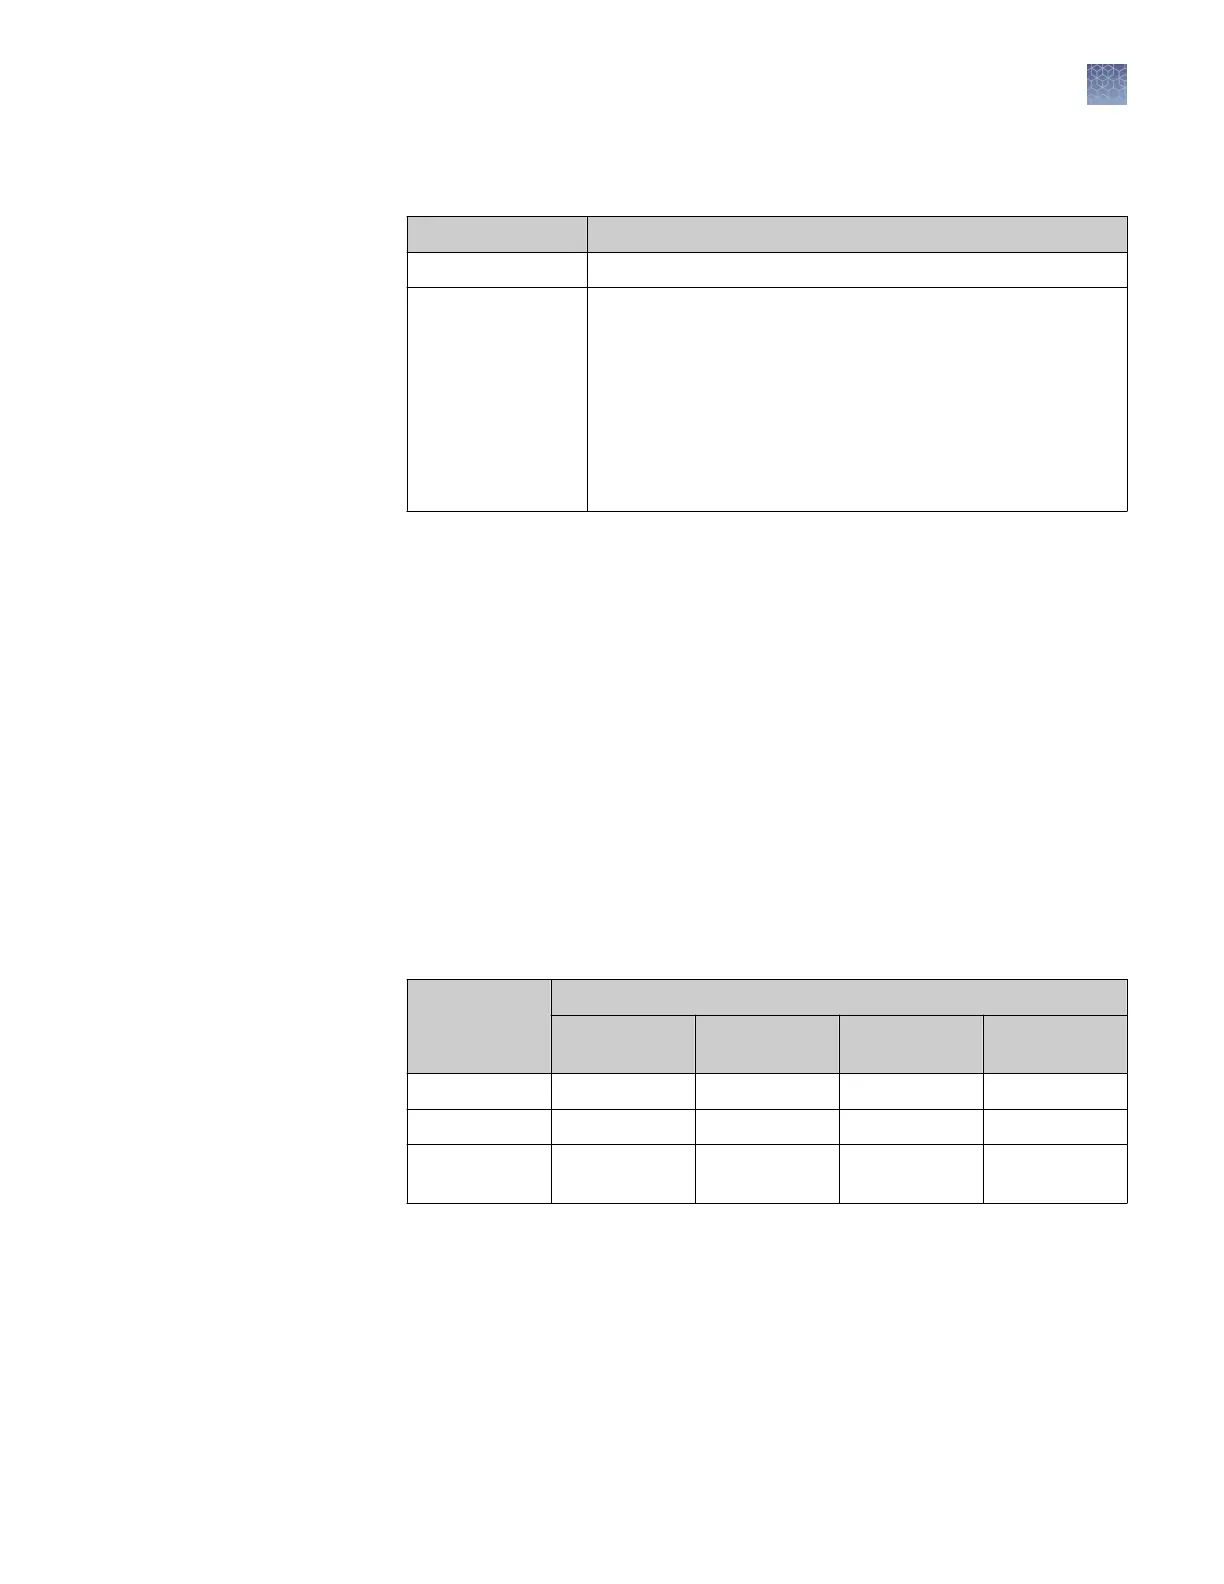
Analysis status Action
Passed The system passed the RNase P run.
Failed
The system failed the RNase P run. Review the data for
outliers.
If the run fails, the software may have included outliers that
caused the initial analysis to fail. Error may cause some wells
to be amplified insufficiently or not at all. These wells typically
produce C
t
values that differ significantly from the average for
the associated replicate wells. If included in the calculations,
these outlying data (outliers) can result in erroneous
measurements.
9.
In the Amplication Plot, select Ct vs. W
ell from the Plot Type menu.
10.
Conrm the uniformity of each replicate population (controls, standards, and
unknowns) on the plate or array card by comparing the groupings of C
t
values:
a.
In the Plate Layout, select the wells containing Unknown Population A:
b.
From the plot, conrm that the C
t
values of the replicate population are
equivalent.
Note: The numbers on the X-axis of the plot correspond to the wells of the
plate or array card. Beginning with well A1, the wells are numbered from
left-to-right, and top-to-boom.
c.
If an outlier is present in the selected population, select the corresponding
well of the plate layout, then click Omit to remove the well from the
analysis. If the total number of outliers for the replicate population exceeds
the limit in the table below, repeat the test using another RNase P plate or
array card.
Sample block
Maximum number of outlier wells that can be removed
Unknown
population A
[1]
Unknown
population B
[2]
Standards
(STD)
[3]
No template
c
ontrols (NTC)
96-well plate
[4]
6 6 1 0
384-well plate 10 10 2 0
TaqMan
®
Array
Card
[5]
4 4 4 0
[1]
5
,000-copy population for 384-well plates; 800-copy population for array cards.
[2]
10,000-copy population for 384-well plates; 1,600-copy population for array cards.
[3]
Maximum number of wells that can be removed from
each
standard population.
[4]
Standard 96-well plates or Fast 96-well plates
[5]
QuantStudio
™
7 Flex System only.
11.
Repeat step 10 for each replicate population (unknowns, standards, and no
template controls) on the plate or array card.
Chapter 2 Calibr
ate the instrument
Verify the instrument performance
2
QuantStudio
™
6 and 7 Flex Real-Time PCR Systems v1.6 Maintenance and Administration Guide
69