Manual, F/T Sensor, Ethernet Axia
Document #9610-05-Ethernet Axia-09
Pinnacle Park • 1031 Goodworth Drive • Apex, NC 27539 • Tel:+1 919.772.0115 • Fax:+1 919.772.8259 • www.ati-ia.com
56
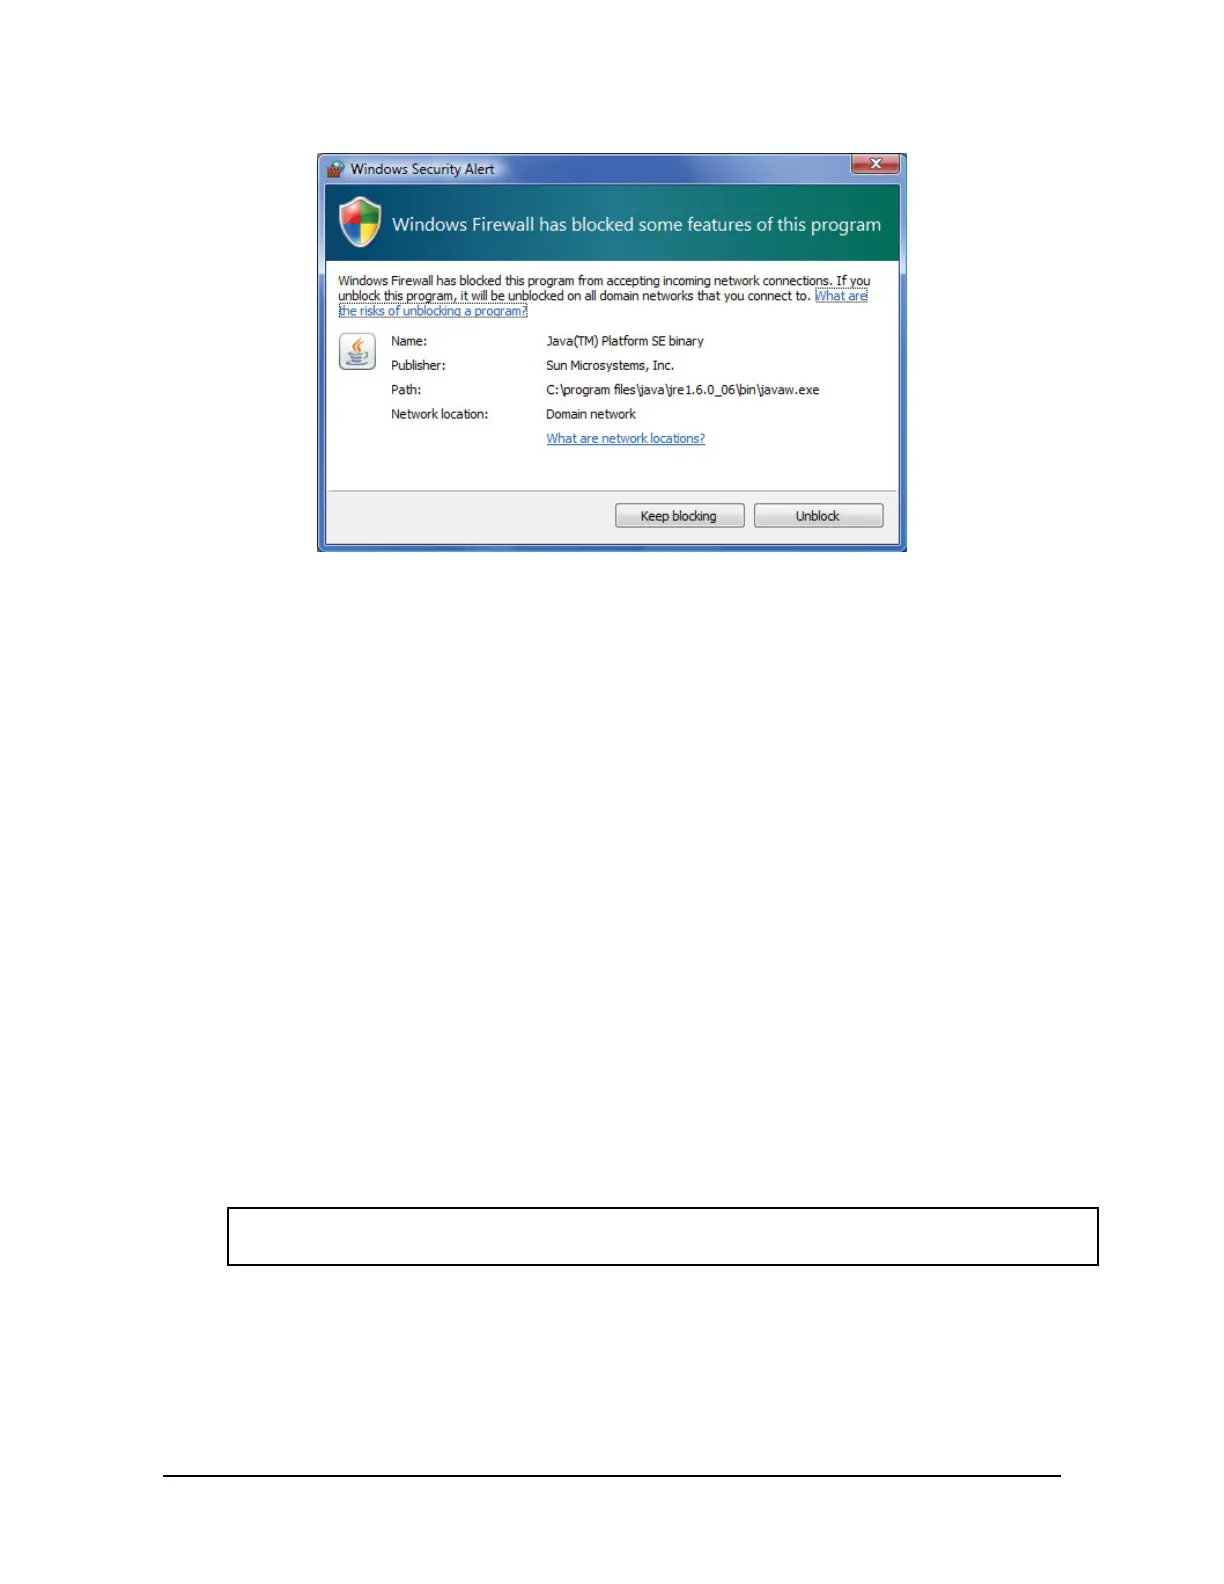
Figure 7.5—Windows Vista Firewall Alert
7.2 Data Display with the Demo
The main screen in Figure 7.3 features a live display of the current F/T data, sequence numbers, and status
code. To understand how to interpret the status code, refer to Section 4.8—Status Code. During normal
operation, the application requests single records, so the RDT sequence remains constant. For more
information about RDT protocol, refer to Section 12—UDP Interface Using RDT.
A cube in the lower screen provides a real-time visual representation of the F/T data. The user can bias the
data and select the calibration conguration.
7.3 Collecting Data with the Demo
To collect F/T data, follow these steps:
1. On the Java
®
demo application main window, select a le to save the data by one of the following
methods (refer to Figure 7.6):
• click the … button to the right of the le selection eld and navigate to the le destination.
• directly type the le path into the le selection eld.
2. Click the Start Collecting button(refer to Figure 7.3):
• The application sends out a request for high-speed data to the Ethernet Axia sensor.
• The user can see the RDT sequence incrementing in real-time because the application requests more
than a single record when in high-speed mode.
• The measurement data are stored in comma-separated value format (CSV) so it can be read by
spreadsheets and data-analysis programs.
3. Name the le with a .CSV extension.
4. Double-click on the le to open it.
NOTICE: If collecting large amounts of data, understand any limitations a spreadsheet or data
analysis program may have to accommodate a certain number of rows.
 Loading...