ATI Series D12 Toxic Gas Transmitter with H10 Smart Sensor
Revision N (7/15) 63
Upon entry, the Date, Time, and Conc variables are set to the most recent sample. Scrolling the Time
variable up increments it by the sampling interval, and causes the next, successive sample to be
displayed at Conc. Scrolling Time down displays the previous sample time, and value. Scrolling Time
up and down will cause a date rollover at midnight. Scrolling the Date variable up increments it by one
day, while holding the Time variable fixed. This is an expedient method to access specific data, and is
useful for examining samples recorded at the time of day.
Once the date and time are set, select the Show_Graphic link to switch to the Graphic Report page.
Data is not updated while viewing the page.
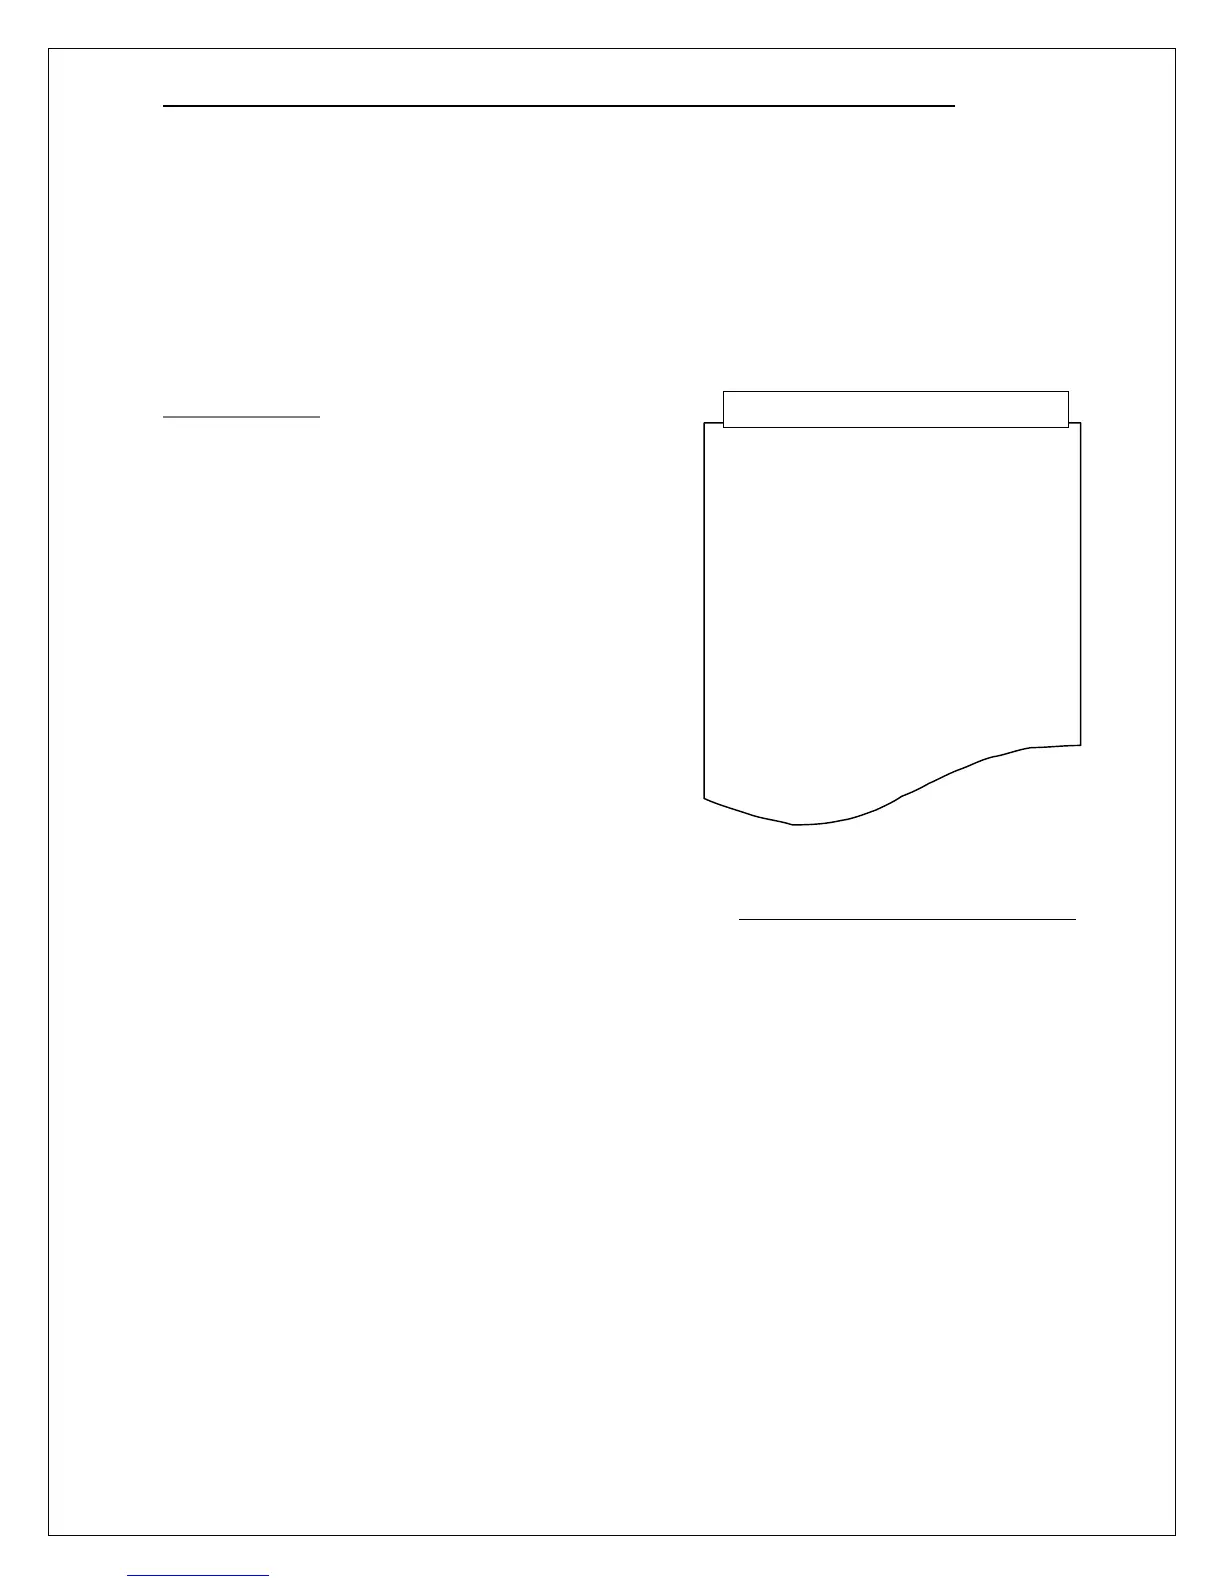
Data-log Printout
Data-log reports may be sent to serial printer, terminal, or
terminal emulation program, such as Microsoft
Hyperterminal®. See Appendix A. details on how to setup
and print reports.
Figure 64. Data-log printout (example)
07/09/06 22:40 0.01 0.00 0.02 0.01
07/09/06 22:44 –0.0 0.00 0.00 –0.0
07/09/06 22:48 0.01 TEST TEST TEST
07/09/06 22:52 TEST TEST TEST TEST
07/09/06 22:56 TEST TEST TEST TEST
07/09/06 23:00 0.07 0.06 0.07 0.06
07/09/06 23:04 0.06 0.05 0.06 0.06
07/09/06 23:08 0.05 0.05 0.04 0.05
07/09/06 23:12 0.06 0.05 0.05 0.04
07/09/06 23:16 0.01 0.01 0.01 0.00
07/09/06 23:20 0.00 0.00 0.00 -0.1
07/09/06 23:24 –0.0 0.00 0.00 0.00
07/09/06 23:28 ---- ---- ---- ----
07/09/06 23:32 ---- ---- ---- ----
07/09/06 23:36 ---- ---- ---- ----
07/09/06 23:40 FFFF FFFF 0.02 0.02