ATI Series D12 Toxic Gas Transmitter with H10 Smart Sensor
Revision N (7/15) 84
Charting with Microsoft Excel
Microsoft Excel can be used to import data log reports and create useful and informative charts.
Start Excel by clicking Start, pointing to Programs, and clicking Microsoft Excel.
When Excel opens, click File and then click Open. Navigate to the data log report file you wish to
chart and click Open. Excel will recognize the report as a text file and offer some configuration
options.
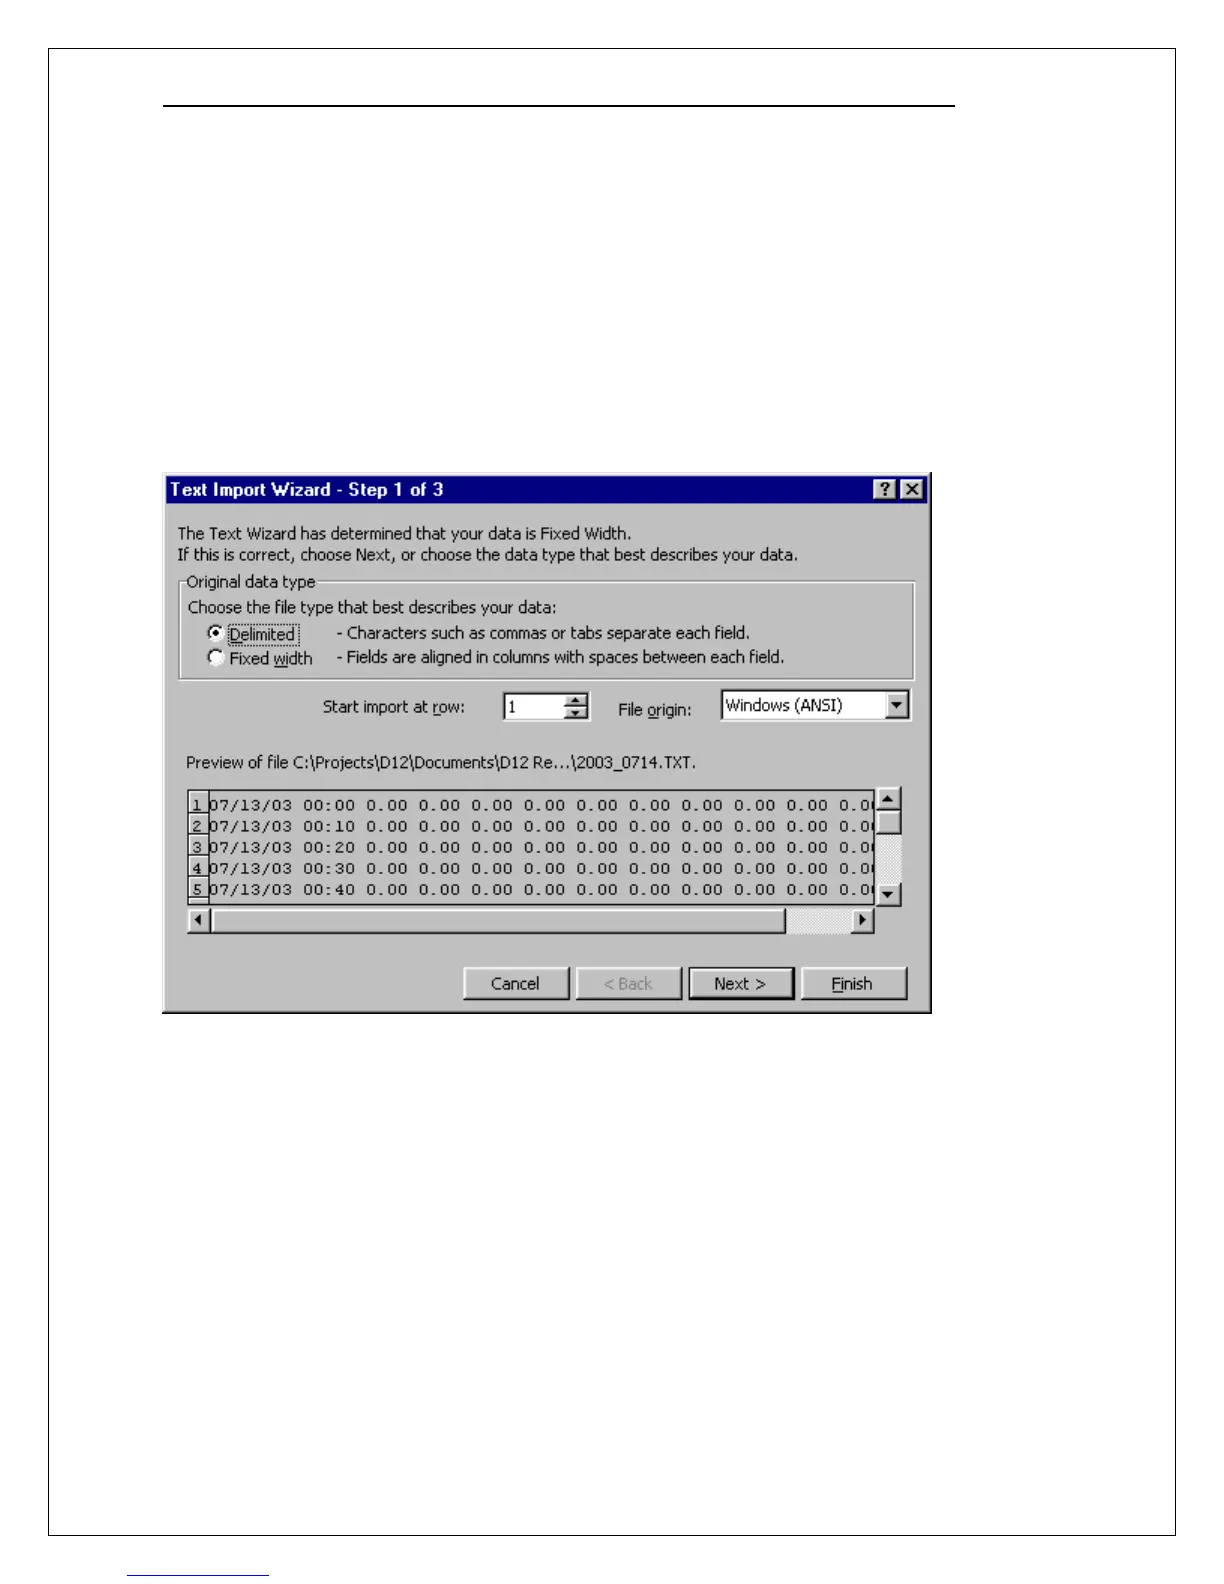
When the Text Import Wizard – Step 1 of 3 appears, configure the settings as shown below and click
Next. (Note that the values in your report file will be different than those shown below.)