PN 177196BB
7-17
DATA MANAGEMENT AND REVIEW
DATA ANALYSIS REVIEW - WBC PARAMETERS
7
DiffPlot Development
1. The DiffPlot is developed from analysis of the DIFF dilution made in the DIFF bath.
a. The Fix reagent in the final dilution lyses the RBCs, stabilizes the WBCs, and
differentially stains the lymphocytes, monocytes, neutrophils, and eosinophils, with
the eosinophils staining most intensely
b. The dilution from the DIFF bath is injected through the flow cell for 15 seconds; for
12 of these 15 seconds, data for developing the DiffPlot is accumulated.
2. DiffPlot analysis on an A
C
•T 5diff AL analyzer is based on three essential principles:
a. Dual Focused Flow (DFF) fluid dynamics, which is a process by which individual
cells are focused in a stream of Diluent (hydrodynamic focusing)
b. Volume measurement (Coulter Principle)
c. Measurement of transmitted light with zero degree (0°) angle, which permits a
response proportional to the internal structure of each cell and its absorbance.
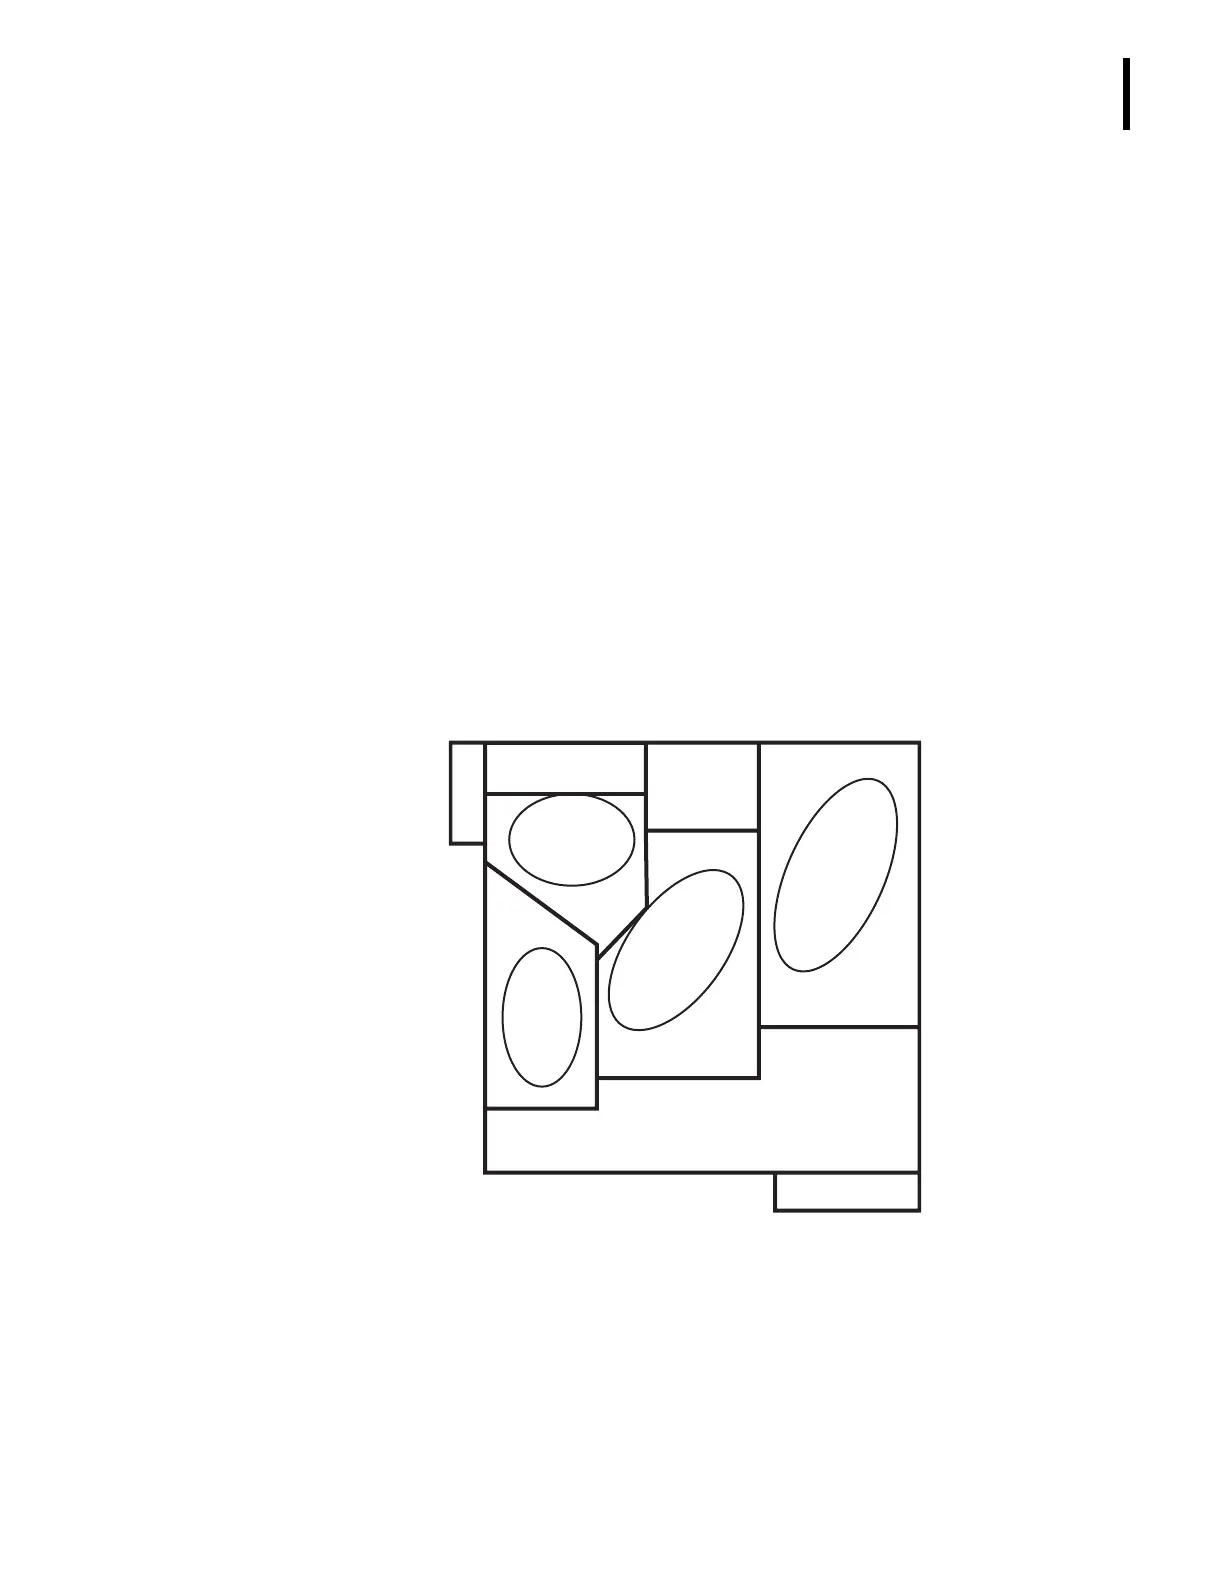
3. From the measurements made in the flow cell, a DiffPlot is developed with optical
transmission (absorbance) on the X-axis and volume (resistance) on the Y-axis.
4. From the DiffPlot, neutrophil %, lymphocyte %, monocyte %, and eosinophil % are
determined.
DiffPlot Regions
1. A study of the DiffPlot permits clear differentiation of four out of five WBC populations.
2. In typical whole-blood sample, the basophil population is very small when compared
with the other four white cell populations.
3. Table 7.5 lists some of the characteristics of the normal WBC differential parameters and
of immature WBCs. The illustration following the table shows the typical locations of
immature WBC populations on the DiffPlot.
VOLUME
ABSORBANCE
Eosinophils
Neutrophils
Monocytes
Lymphs
 Loading...


