SECTION 3 OPERATING THE BIS VISTA MONITORING SYSTEM
______________________________________________________________________
3-6
3.3 BIS Trend Data Screen
Once the sensor check has successfully completed, monitoring begins and the corresponding
information appears on the screen.
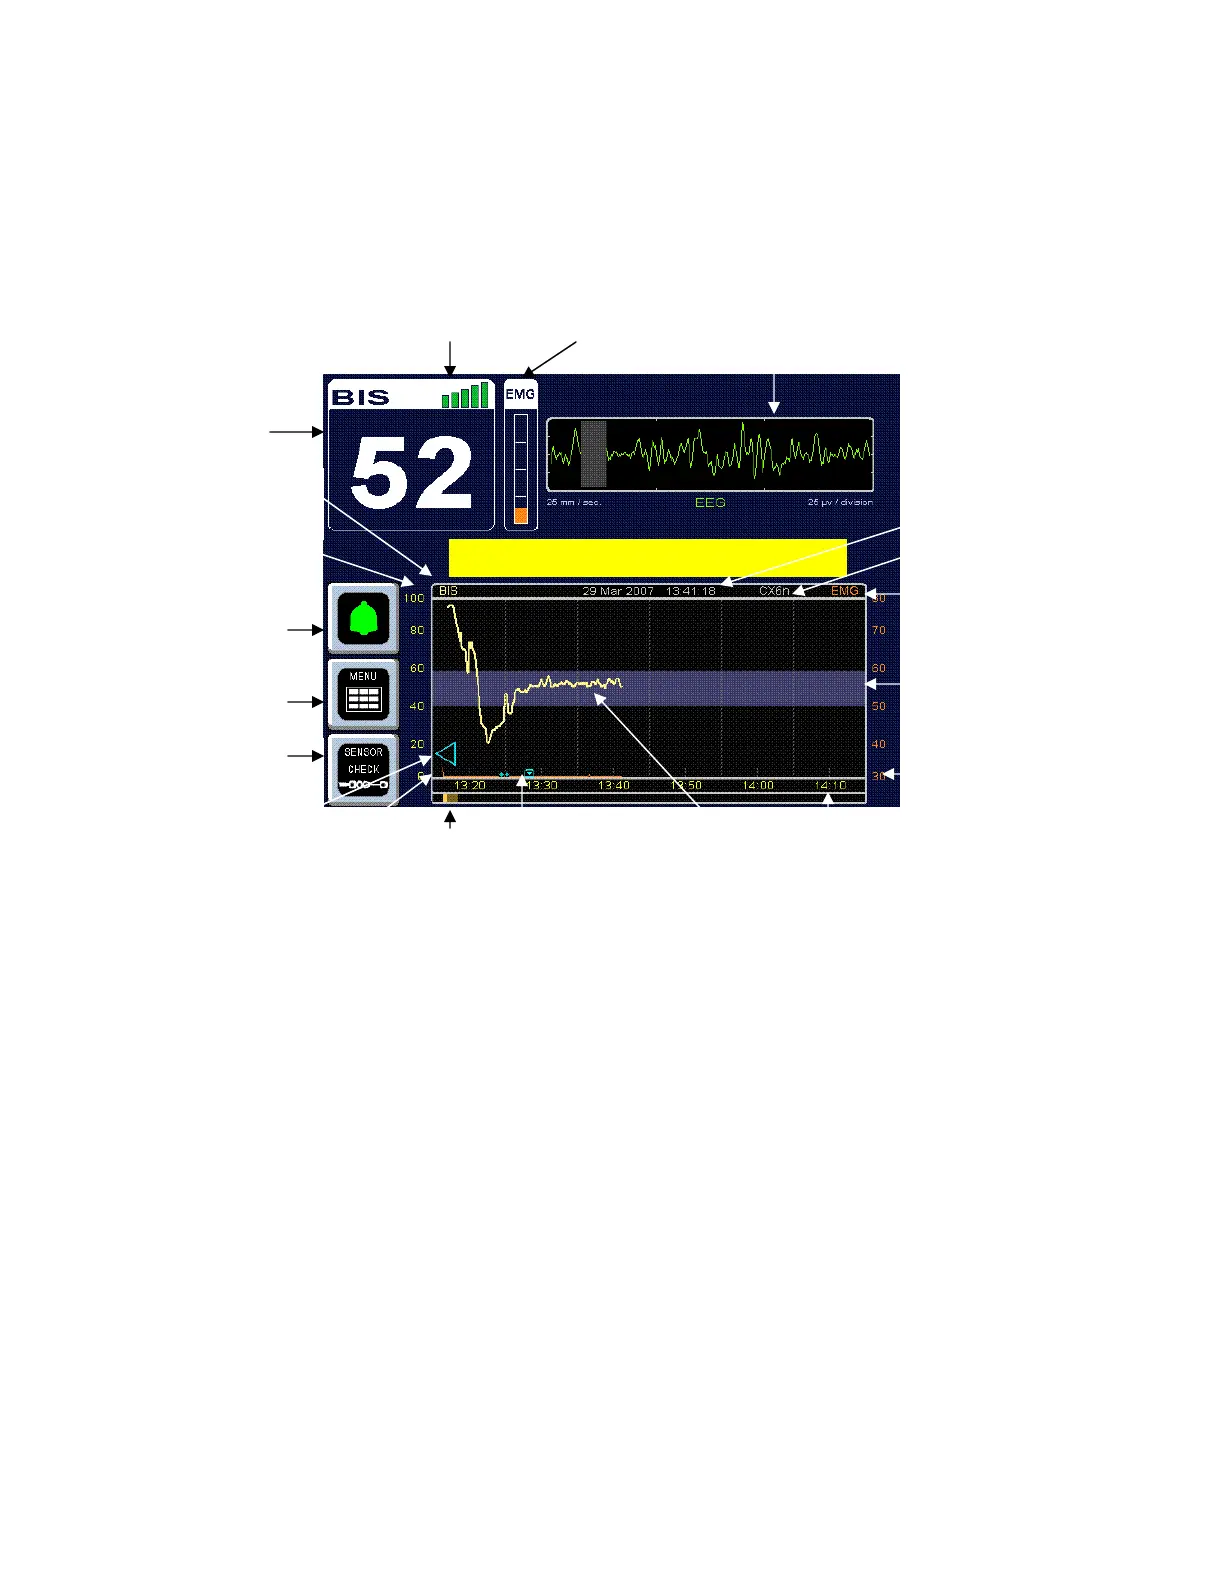
Figure 9 - Screen Features – BIS Trend Data Screen
3.3.1 BIS (Bispectral Index) Value
The current numeric value of the BIS is displayed in the upper left corner of the screen.
The BIS number is displayed and continuously updated during all display modes as long as
signal quality is sufficient.
3.3.2 Signal Quality Indicator
The Signal Quality Indicator (SQI) is a measure of the signal quality for the EEG channel
source and is calculated based on impedance data, artifact, and other variables. It is displayed
in the upper left corner of the screen, to the right of the “BIS” label. Signal quality is optimal
when all five bars of the SQI icon are green. When signal quality is too low to accurately
calculate a BIS value, the BIS value and other trend variables that are adversely affected by
artifact will not be displayed on the screen.
Si
nal
ualit
Indicator EMG Indicator EEG Waveform
BIS Value
Primary Variable
Name
larm Pause/Silence
Touch Key
Menu/Home
Touch Key
Sensor Check
Touch Key
BIS Trend
Unit Labels
Review
Snapshot
Event Marker
rtifact
Current Time and Date
Secondar
Variable Name
Secondary Variable
Unit Labels
arget Range
rend Time Scale
Case ID
BIS Trend
MESSAGE REGION
Secondary