SECTION 3 OPERATING THE BIS VISTA MONITORING SYSTEM
______________________________________________________________________
3-15
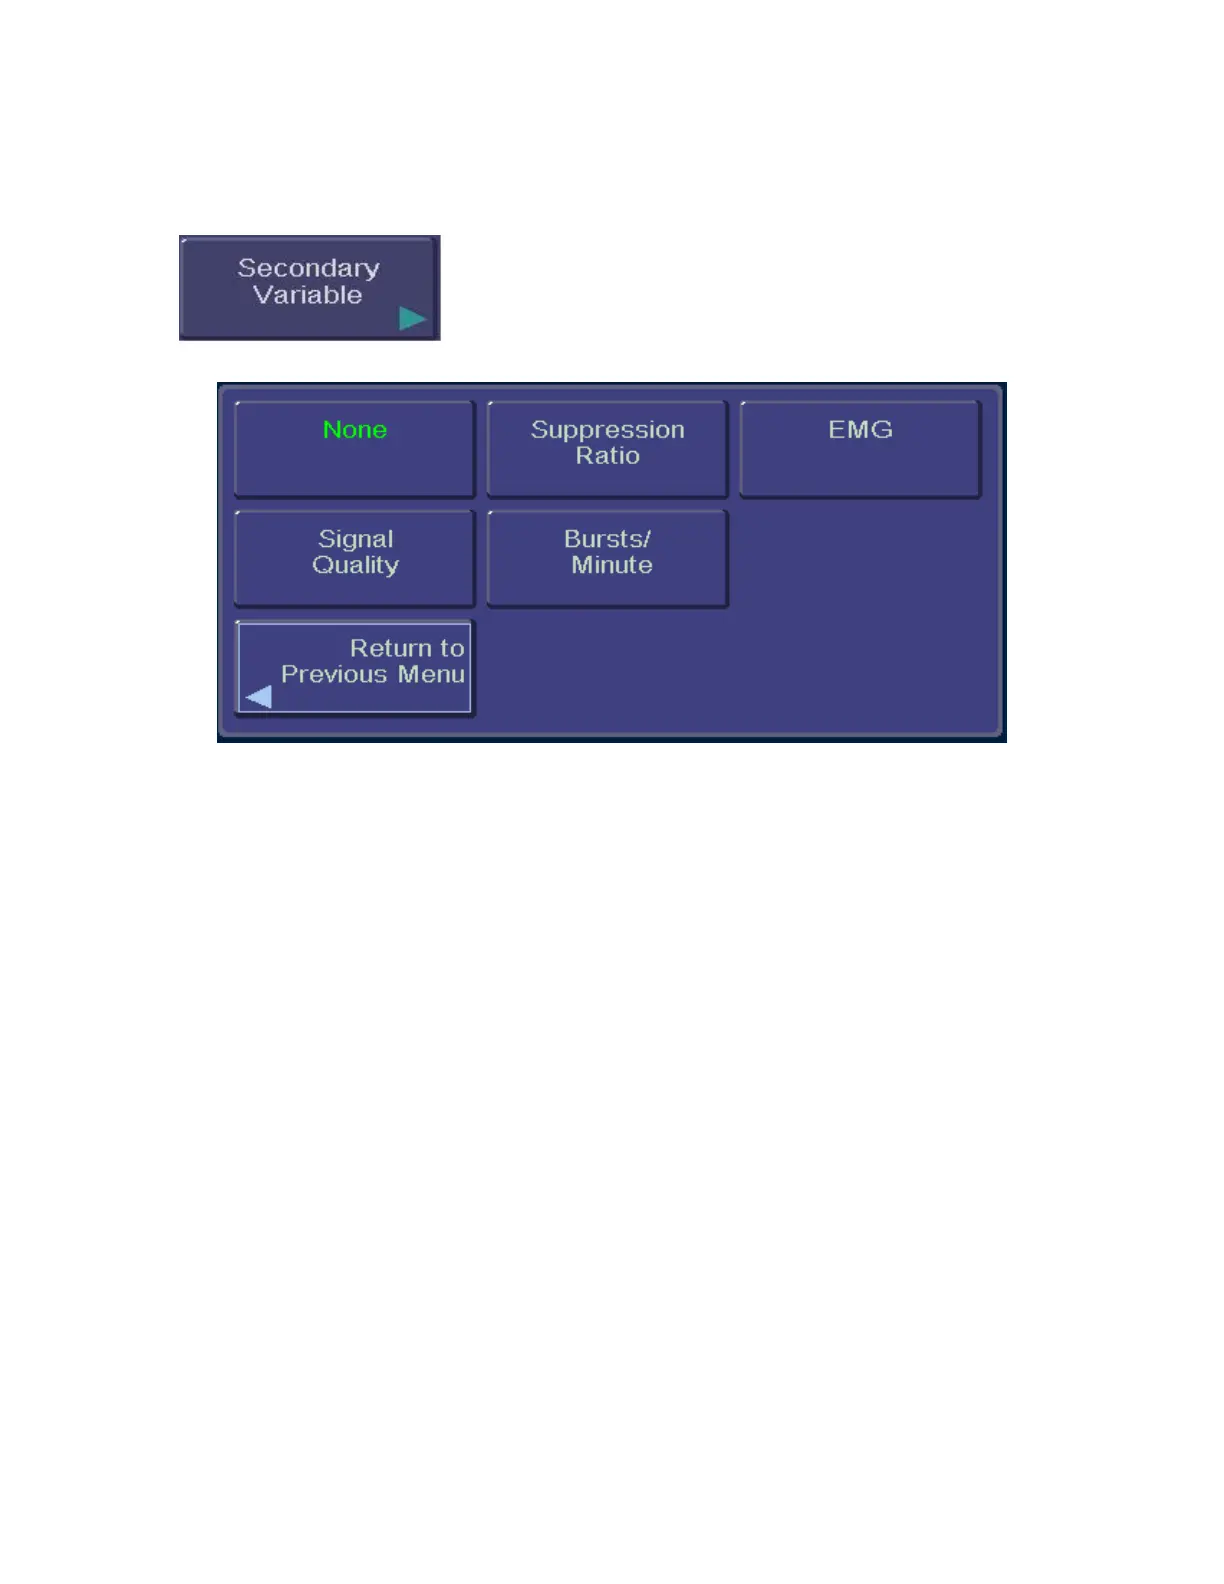
3.5.2 Secondary Variable
To access Secondary Variable, press [MENU].
Figure 14 - Secondary Variable
This option allows the user to add a secondary trend variable to the Trend Graph:
• Selecting “Suppression Ratio” will plot the suppression ratio.
• Selecting “EMG” will plot electromyograph or high frequency signal detection.
• Selecting “Signal Quality” will plot a number (0 – 100) that indicates the quality of
the EEG signal received and processed.
• Selecting “Bursts/Minute” will plot the burst count in number of bursts per
minute. Note that this is available only when a BIS Extend Sensor is attached to the
PIC. If a BIS Extend Sensor is not connected, this menu option does not appear.
• Selecting “None” removes the secondary variable from the graph.
To specify a secondary variable:
1. Press [MENU] to access menu options.
2. The [Secondary Variable] touch key displays the options available. The current
setting displays in green.
3. Press the desired touch key (Suppression Ratio, EMG, Signal Quality,
Bursts/Minute, or None).
4. When the desired setting is displayed in green letters, press [Return to Previous
Menu] or [HOME] to exit.
To permanently save this change, press the [View/Save Settings] touch key in the menu
system, then press [Save Active].