SECTION 3 OPERATING THE BIS VISTA MONITORING SYSTEM
______________________________________________________________________
3-7
3.3.3 Electromyograph (EMG) Indicator
The EMG bar graph displays the power (in decibels) in the frequency range 70 - 110 Hz.
This frequency range contains power from muscle activity (i.e., electromyography or
“EMG”) as well as power from other high-frequency artifacts. When the indicator is low, it
indicates that EMG activity is low. BIS monitoring conditions are optimal when the bar
is empty.
1 bar represents power in the 30-38 range
2 bars represent power in the 39-47 range
3 bars represent power in the 48-55 range
4 bars represent power greater than 55.
3.3.4 EEG Waveform Display
Filtered electroencephalogram (EEG) waveforms are displayed above the BIS trend graph
with a sweep rate of 25 millimeters per second and a scale of 25 microvolts (1 channel) or 50
microvolts (2 channels) per division. One or two channels of EEG may be displayed in this
area. EEG filters can be turned off, if desired.
An alternate screen display is available to view the waveforms in a larger format. Refer to
Section 3.7 “EEG Display” for information.
3.3.5 Message Region
The Message Region is a space reserved for status and error messages. These messages are
prioritized so that a high priority message displays before a lower priority message. The
background color of the message indicates its priority:
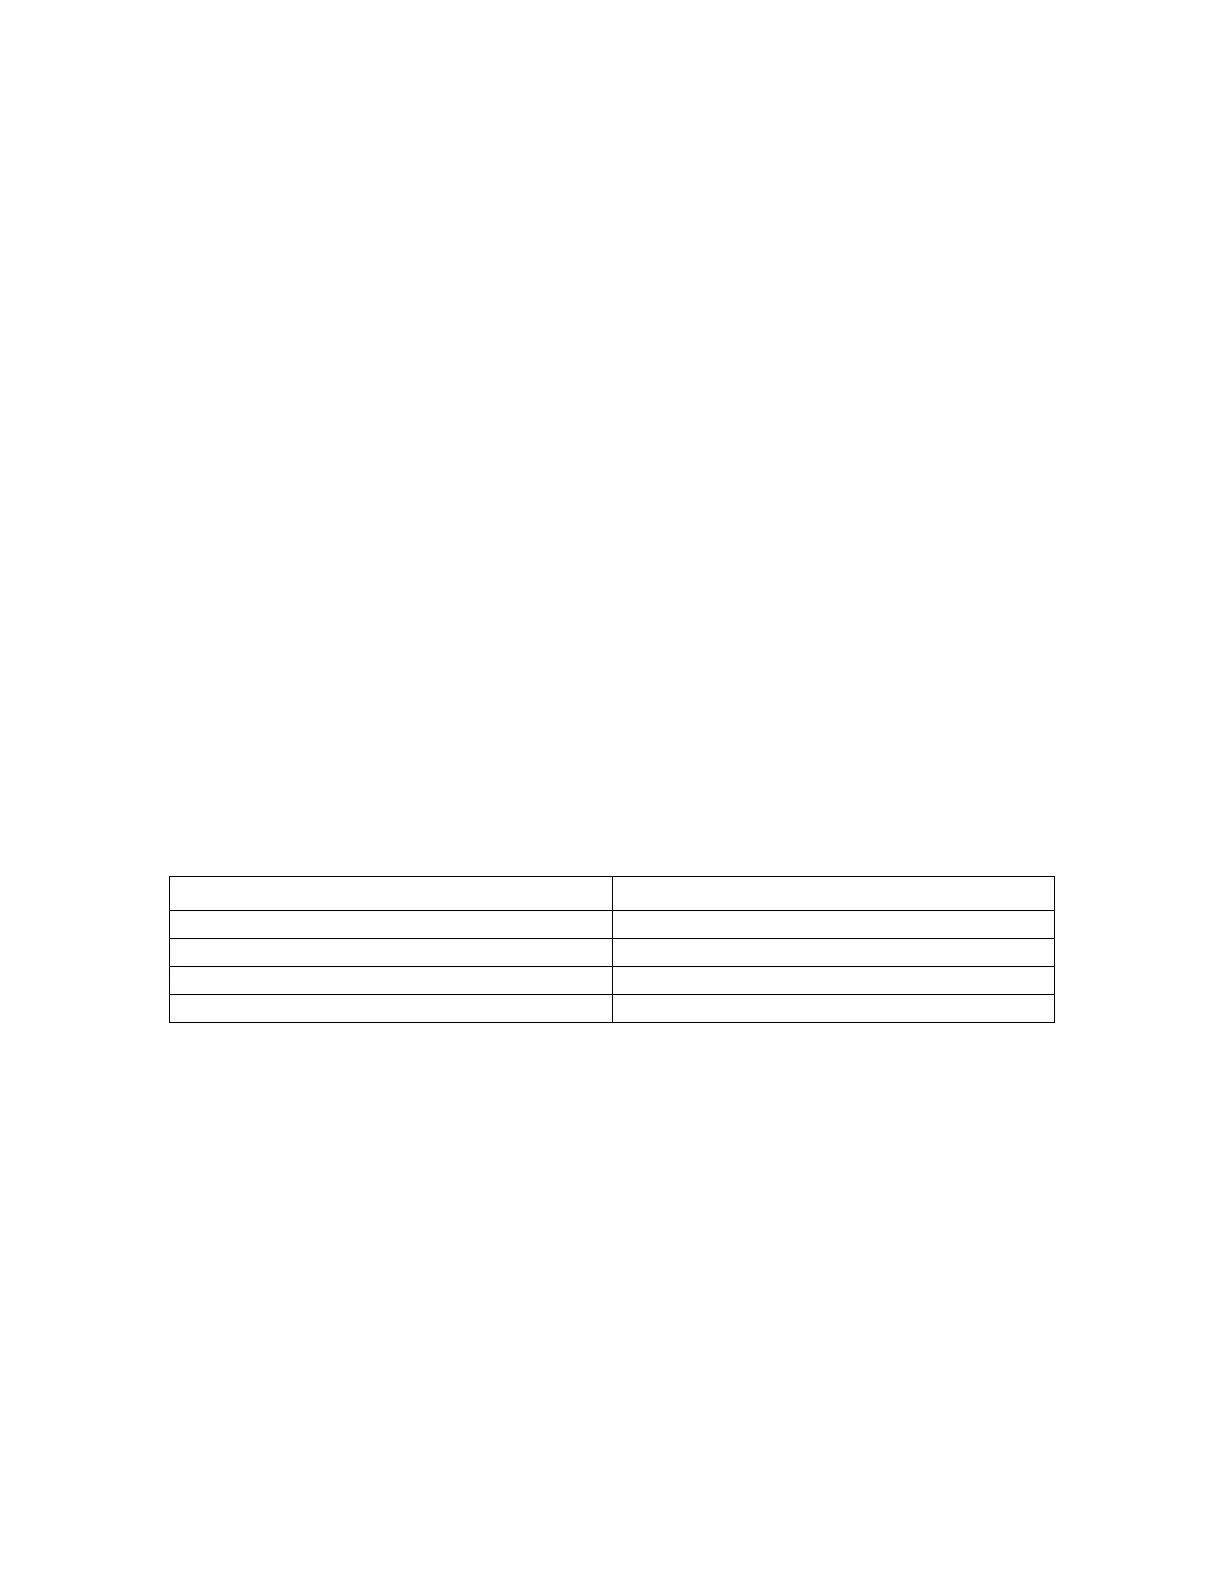
Message Priority Background Color
High Orange
Medium Yellow
Low Grey
Information only Dark Blue
Diagnostic codes may be displayed above the messages by activating them in the Diagnostic
Menu. Specific error messages are explained in the Troubleshooting section of this manual
(Section 6).