SECTION 3 OPERATING THE BIS VISTA MONITORING SYSTEM
______________________________________________________________________
3-16
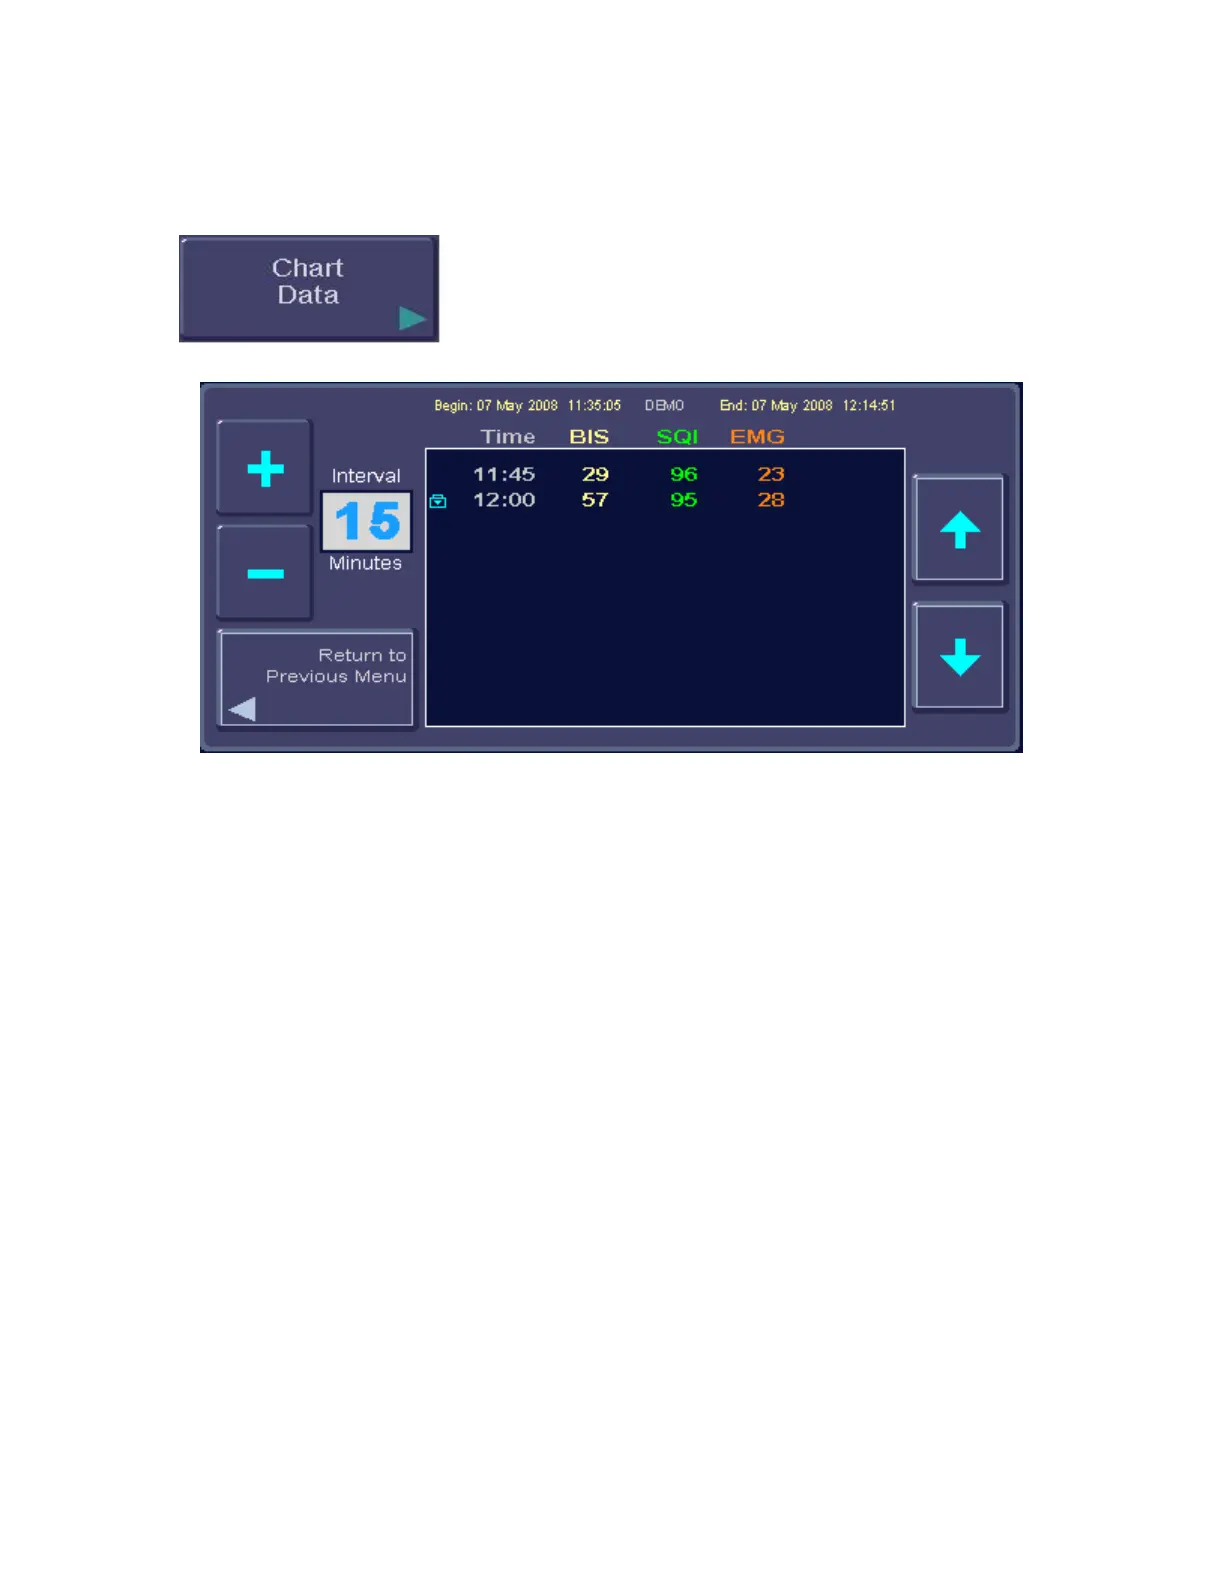
3.5.3 Chart Data
To access Chart Data press [MENU].
Figure 15 - Chart Data
When selected, this option provides a listing of BIS, SQI and EMG values at a selected
interval, so that they can be recorded on the patient chart. The charting interval can be
changed by the user. Available intervals are 1, 5, 10, 15, 30, and 60 minutes. If a data
snapshot was taken during the case, the snapshot icon appears on the chart at the
corresponding time.
To chart data:
1. Press [MENU] to enter the menu system.
2. Press the [Chart Data] touch key. The Chart display appears.
3. To change the charting interval, use the [+] and [-] touch keys. Available intervals
are 1, 5, 10, 15, 30 and 60 minutes.
4. Use the [↑] and [↓] arrows to scroll through the data.
5. Press [Return to Previous Menu] or [HOME] to exit.