Brookeld Engineering Labs., Inc. Page 36 Manual No. M13-167-A0415
Figure III-11
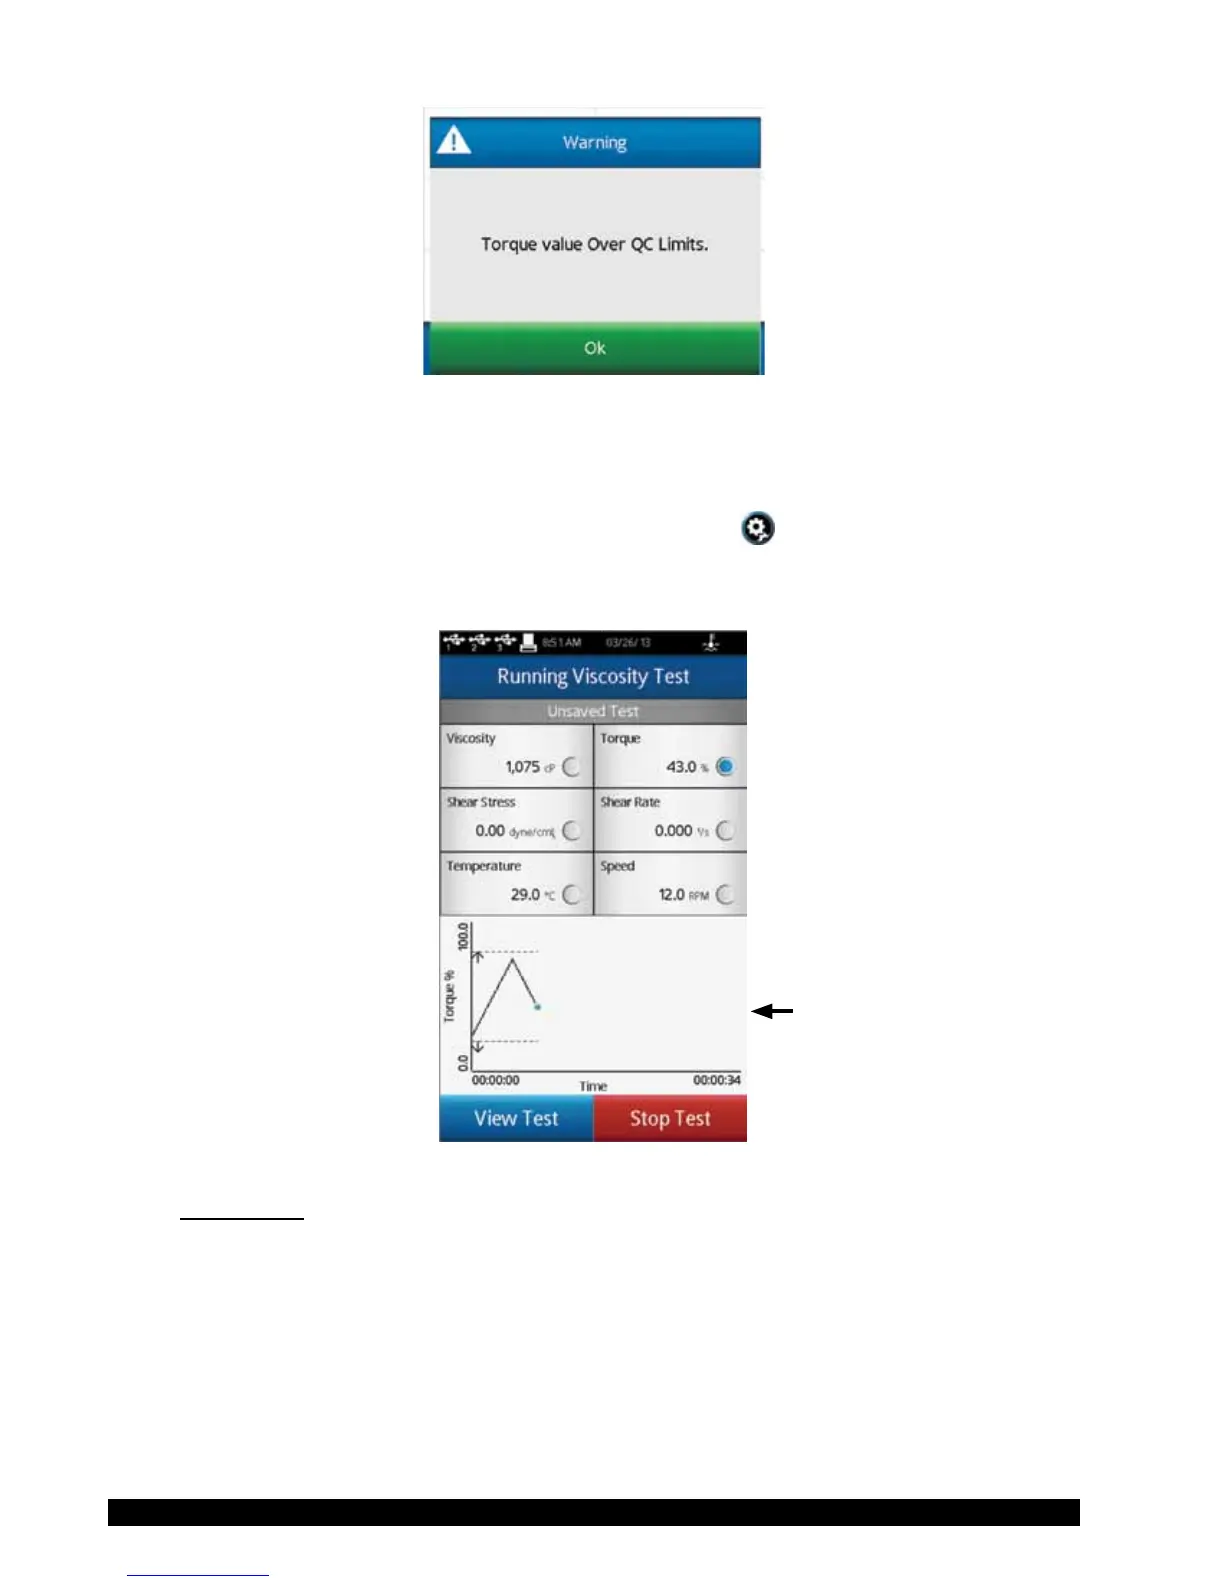
WhenViscosityorTorquearetheselectedQCLimitsparameter,QCLimitswillbeshownduring
thetestontheRealTimeGraphifthatparameterisselectedfordisplay(seeFigureIII-12).The
QCLimitsarerepresentedbythedashedlines.
TIP:AudiblealarmsmaybeturnedoffintheUserSettings
.
TIP: AnindicationofaQCLimitviolationisnotpartofthedataset.Theusercanrecorda
violationbyusingtheNotesavailablewhenviewingtestResults(seeSectionIII.11).
Trend Bar
Figure III-12
Instructions:Recordspecicinstructionstotheoperator.Thisinformationwillbepresented
immediatelywhentheprogramisRun(seeFigureIII-13).Theoperatorisrequired
toacknowledgethemessagebeforetheprogramwillcontinue.