121
•You can use the set up screen settings to alter the appearance of the graph
screen as shown below.
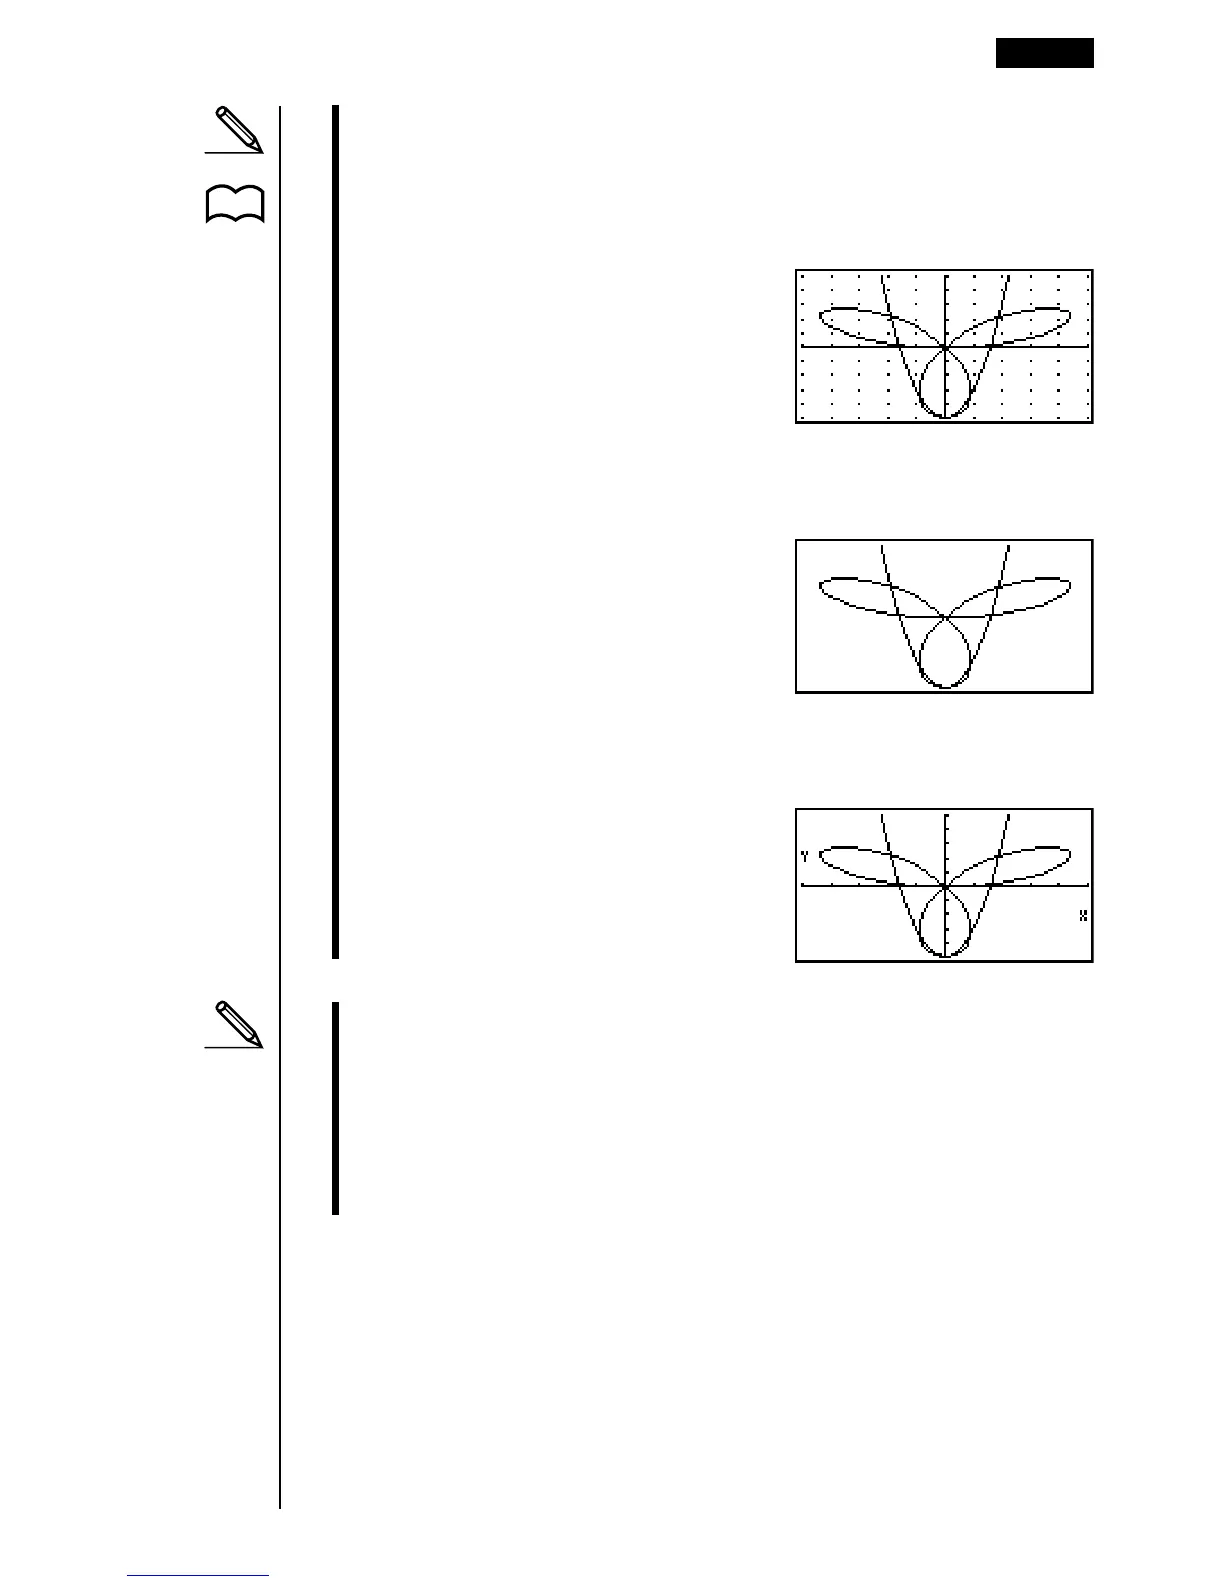
•Grid: On (Axes: On Label: Off)
This setting causes dots to appear at the grid intersects on the display.
•Axes: Off (Label: Off Grid: Off)
This setting clears the axis lines from the display.
• Label: On (Axes: On Grid: Off)
This setting displays labels for the x- and y-axes.
•A polar coordinate (r =) or parametric graph will appear coarse if the settings
you make in the View Window cause the T,
θ
pitch value to be too large,
relative to the differential between the T,
θ
min and T,
θ
max settings. If the
settings you make cause the T,
θ
pitch value to be too small relative to the
differential between the T,
θ
min and T,
θ
max settings, on the other hand, the
graph will take a very long time to draw.
•Attempting to draw a graph for an expression in which X is input for an X =
constant expression results in an error.
Graph Function Operations 8 - 3
P.6