184
13-3 Drawing a Dynamic Graph
The following is the general procedure you should use to draw a Dynamic Graph.
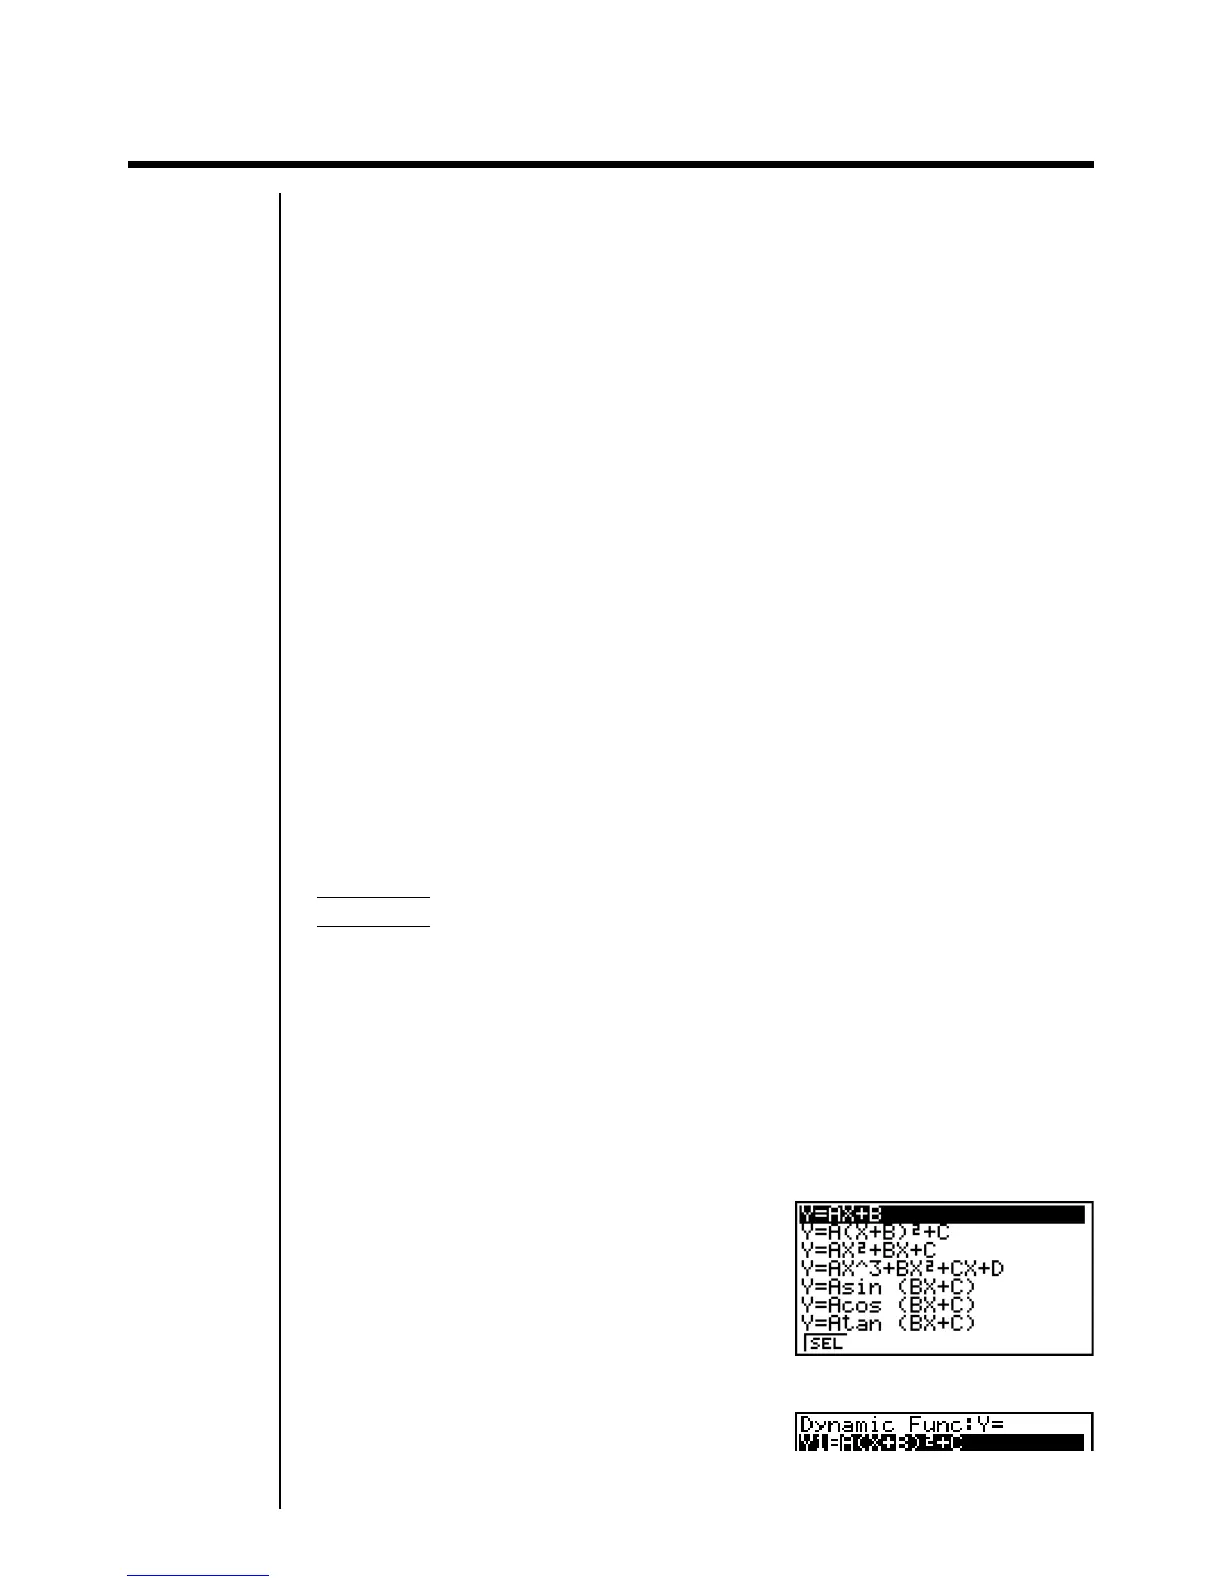
1. Select or input a function.
2. Define the dynamic coefficient.
• This is a coefficient whose value changes in order to produce the different
graphs.
• If the dynamic coefficient is already defined from a previous operation, you can
skip this step.
3. Assign values to each of the coefficients of the function.
4. Specify the range of the dynamic coefficient.
• If the range of the dynamic coefficient is already defined from a previous
operation, you can skip this step.
5. Specify the speed of the draw operation.
• If the speed is already defined from a previous operation, you can skip this
step.
6. Draw the Dynamic Graph.
uu
uu
uTo set Dynamic Graph conditions
Example To use Dynamic Graph to graph y = A (x–1)
2
–1 as the value of
A changes from 2 to 5 in increments of 1
Use the following View Window parameters.
Xmin = – 6.3 Ymin = – 3.1
Xmax = 6.3 Ymax = 3.1
Xscale = 1 Yscale = 1
1. Input the function you want to graph. Here we will edit a built-in function to
input our function.
5(B·IN)
c1(SEL)
1 23456