123
8-5 Drawing Graphs Manually
After you select the RUN icon in the Main Menu and enter the RUN Mode, you
can draw graphs manually. First press ! 4 (Sketch) 5 (GRPH) to recall the
Graph Command Menu, and then input the graph function.
• {Y=}/{r=}/{Parm}/{X=c}/{G∫dx} ... {rectangular coordinate}/{polar coordinate}/
{parametric}/{X = constant}/{integration} graph
• {Y>}/{Y<}/{Y
tt
tt
t}/{Y
ss
ss
s} ... {Y>f(x)}/{Y<f(x)}/{Y>f(x)}/{Y<f(x)} inequality graph
uu
uu
uTo graph using rectangular coordinates (Y =) [Sketch]-[GRPH]-[Y=]
You can graph functions that can be expressed in the format y = f(x).
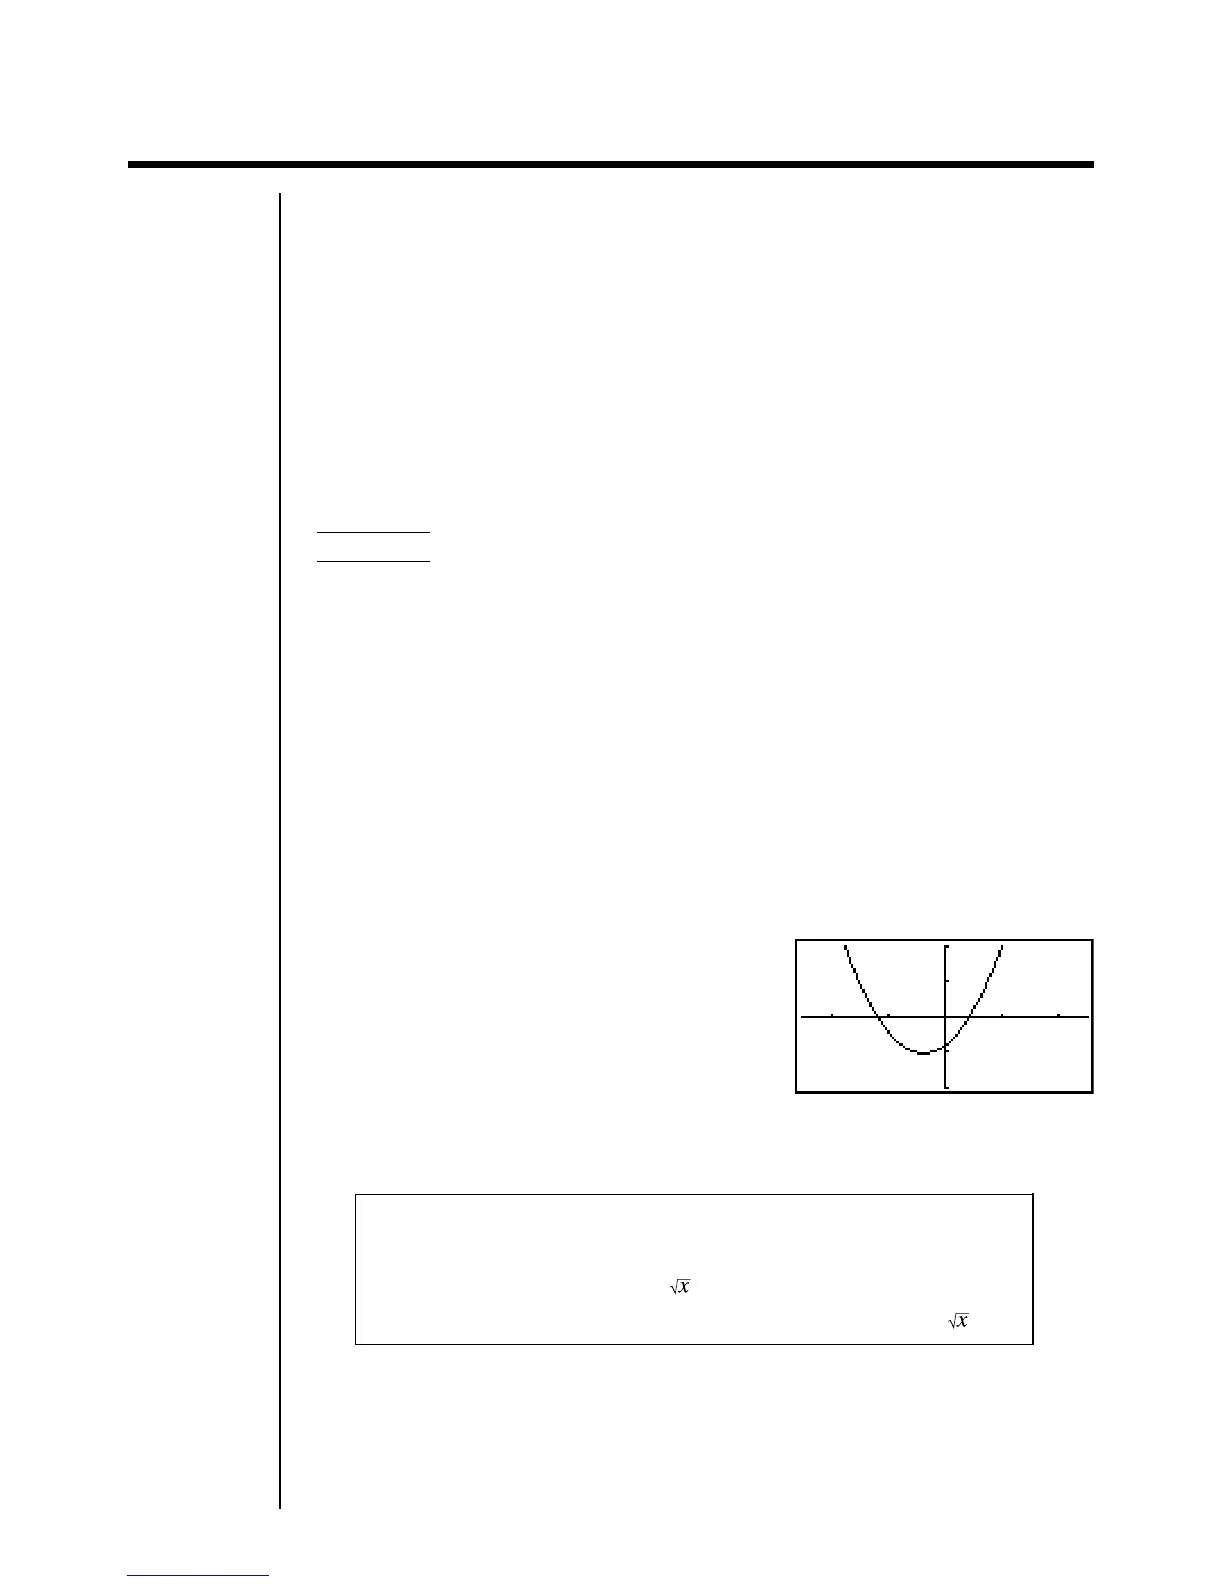
Example To graph y = 2x
2
+ 3x – 4
Use the following View Window parameters.
Xmin = –5 Ymin = –10
Xmax = 5 Ymax = 10
Xscale = 2 Yscale = 5
1. In the set up screen, specify “Y=” for Func Type and then press J.
2. Input the rectangular coordinate (Y =) expression.
!4(Sketch)1(Cls)w
5(GRPH)1(Y =) cvx+dv-e
3. Press w to draw the graph.
•You can draw graphs of the following built-in scientific functions.
• sin x • cos x • tan x • sin
–1
x • cos
–1
x
• tan
–1
x • sinh x • cosh x • tanh x • sinh
–1
x
• cosh
–1
x • tanh
–1
x • • x
2
• log x
• lnx • 10
x
• e
x
• x
–1
•
3
View Window settings are made automatically for built-in graphs.