124
uu
uu
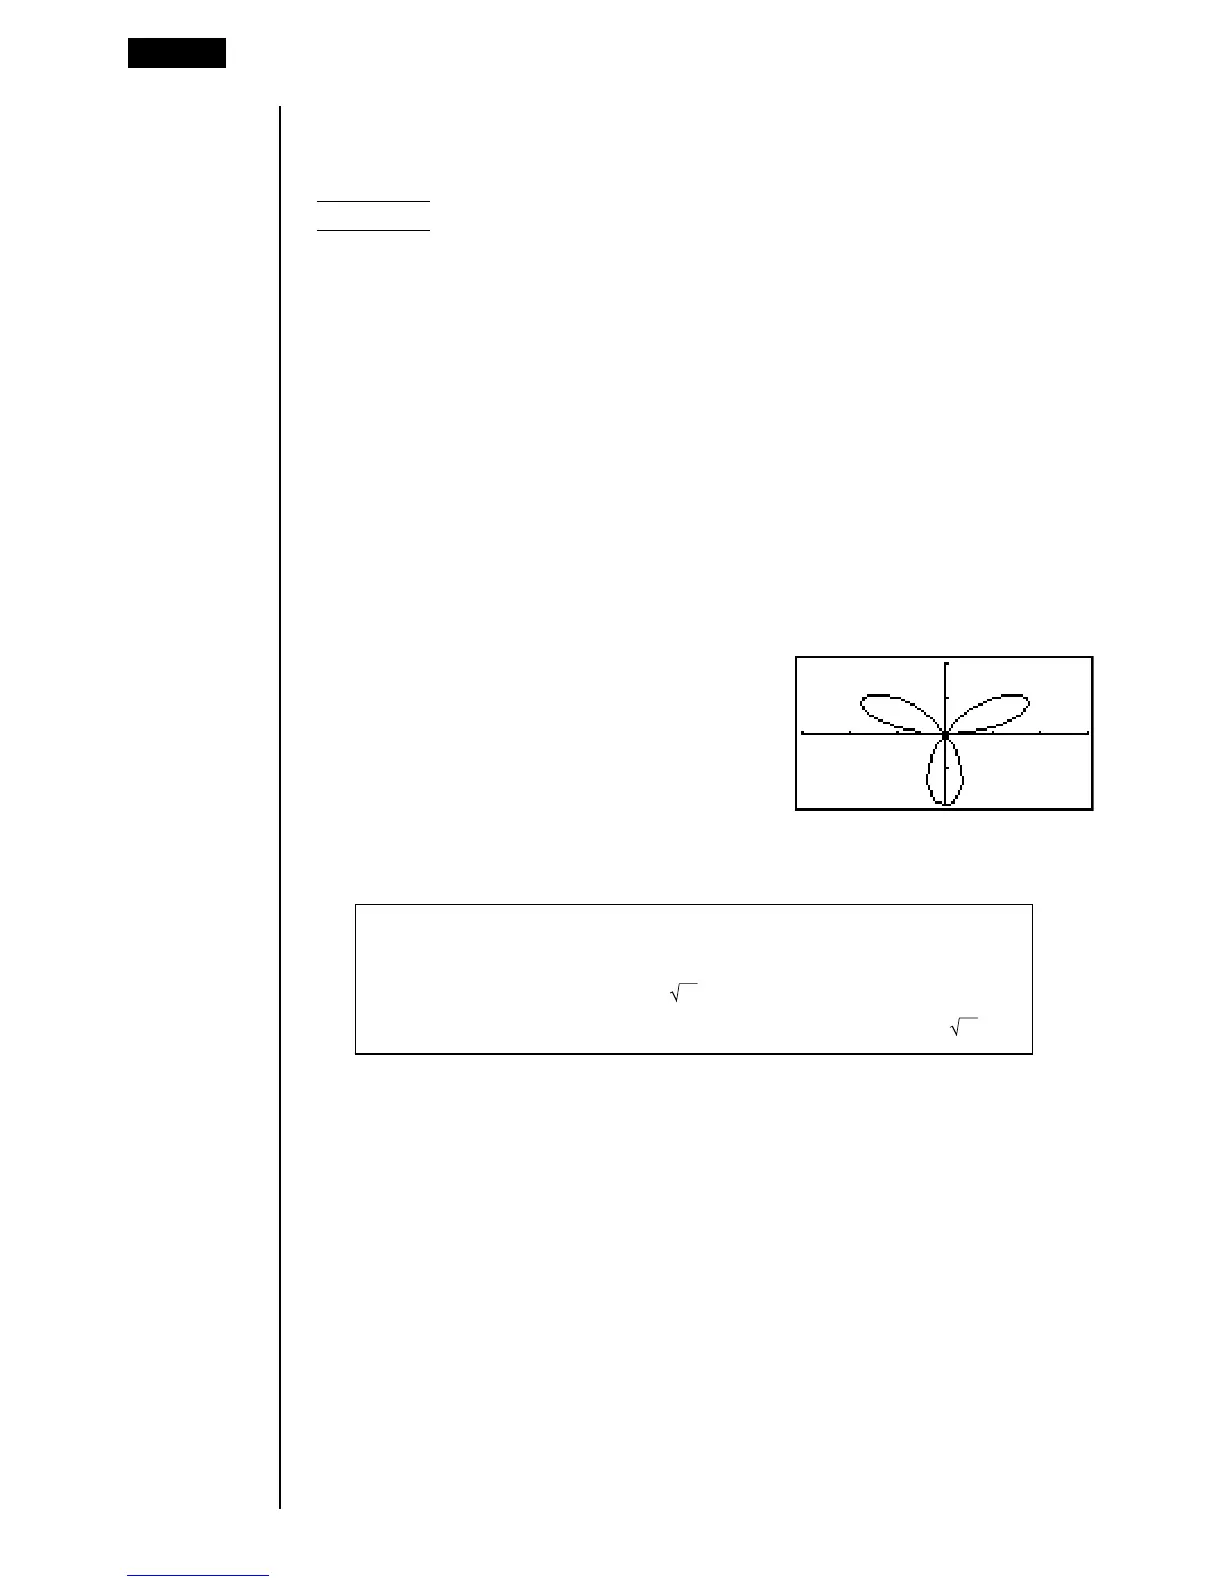
uTo graph using polar coordinates (r =) [Sketch]-[GRPH]-[r=]
You can graph functions that can be expressed in the format
r = f
(
θ
).
Example To graph r = 2 sin3
θ
Use the following View Window parameters.
Xmin = –3 Ymin = –2 T,
θ
min = 0
Xmax = 3 Ymax = 2 T,
θ
max = π
Xscale = 1 Yscale = 1 T,
θ
pitch = π÷36
1. In the set up screen, specify “r =” for Func Type.
2. Specify “Rad” as the angle unit and then press J.
3. Input the polar coordinate expression (r =).
!4(Sketch)1(Cls)w
5(GRPH)2(r =)csdv
4. Press w to draw the graph.
•You can draw graphs of the following built-in scientific functions.
• sin
θ
• cos
θ
• tan
θ
• sin
–1
θ
• cos
–1
θ
• tan
–1
θ
• sinh
θ
• cosh
θ
• tanh
θ
• sinh
–1
θ
• cosh
–1
θ
• tanh
–1
θ
•
θ
•
θ
2
• log
θ
• ln
θ
• 10
θ
• e
θ
•
θ
–1
•
3
θ
View Window settings are made automatically for built-in graphs.
8 - 5 Drawing Graphs Manually