155
10-2 Graphing with the Sketch Function
The sketch function lets you draw lines and plot points on a graph that is already
on the screen.
All the examples in this section that show operations in the STAT, GRAPH, TABLE,
RECUR, and CONICS Modes are based on the assumption that the following
function has already been graphed in the GRAPH Mode.
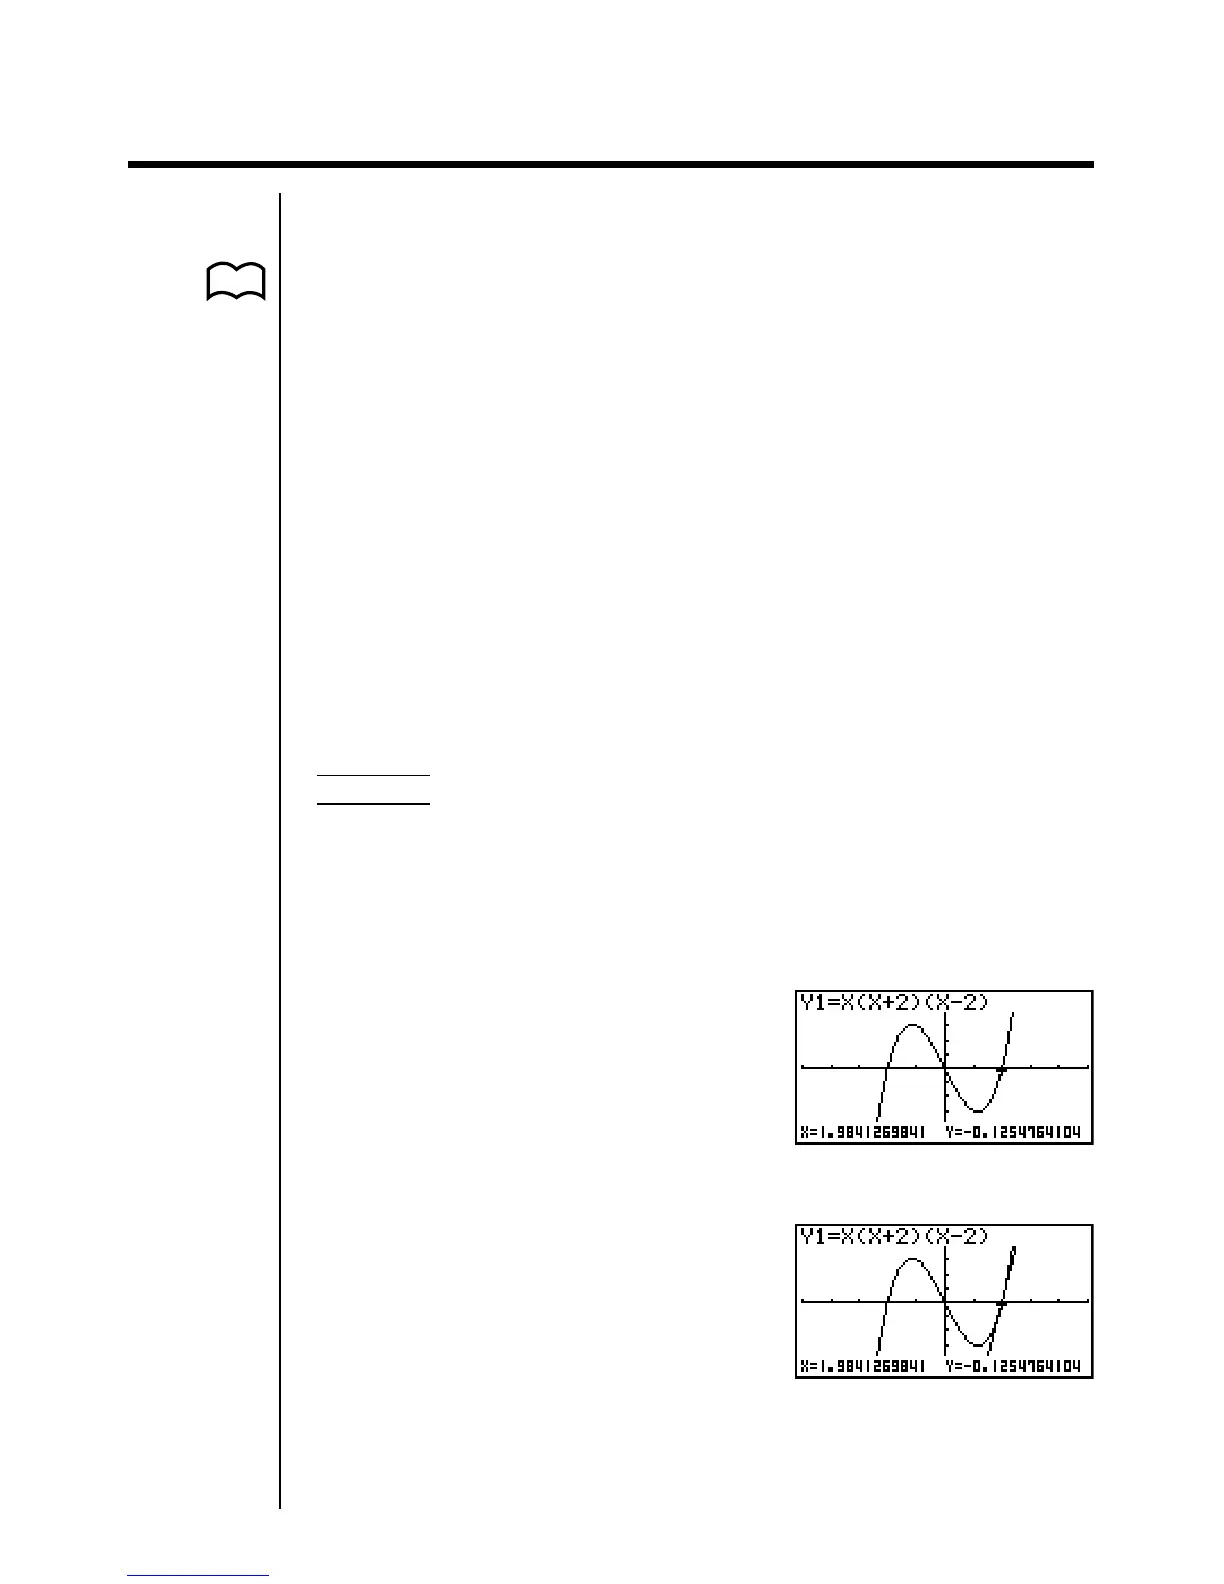
Memory Area Y1 = x(x + 2)(x – 2)
The following are the View Window parameters used when drawing the graph.
Xmin = –5 Ymin = –5
Xmax = 5 Ymax = 5
Xscale = 1 Yscale = 1
kk
kk
k Tangent [Sketch]-[Tang]
This function lets you draw a line that is tangent to a graph at any point.
uu
uu
uTo draw a tangent in the GRAPH or TABLE Mode
ExampleTo draw a line that is tangent to point (x = 2, y = 0) of y = x(x + 2)
(x – 2)
1. After graphing the function, display the sketch menu and press 2 (Tang).
2. Use the cursor keys to move the pointer the position of the point where you
want to draw the line.
3. Press w to draw the line.
P.112