128
8-6 Other Graphing Functions
The functions described in this section tell you how to read the x- and y-coordi-
nates at a given point, and how to zoom in and zoom out on a graph.
• These functions can be used with rectangular coordinate, polar coordinate,
parametric, X = constant, and inequality graphs only.
kk
kk
k Connect Type and Plot Type Graphs (Draw Type)
You can use the Draw Type setting of the set up screen to specify one of two
graph types.
•Connect
Points are plotted and connected by lines to create a curve.
• Plot
Points are plotted without being connected.
kk
kk
k Trace
With trace, you can move a flashing pointer along a graph with the cursor keys
and obtain readouts of coordinates at each point. The following shows the different
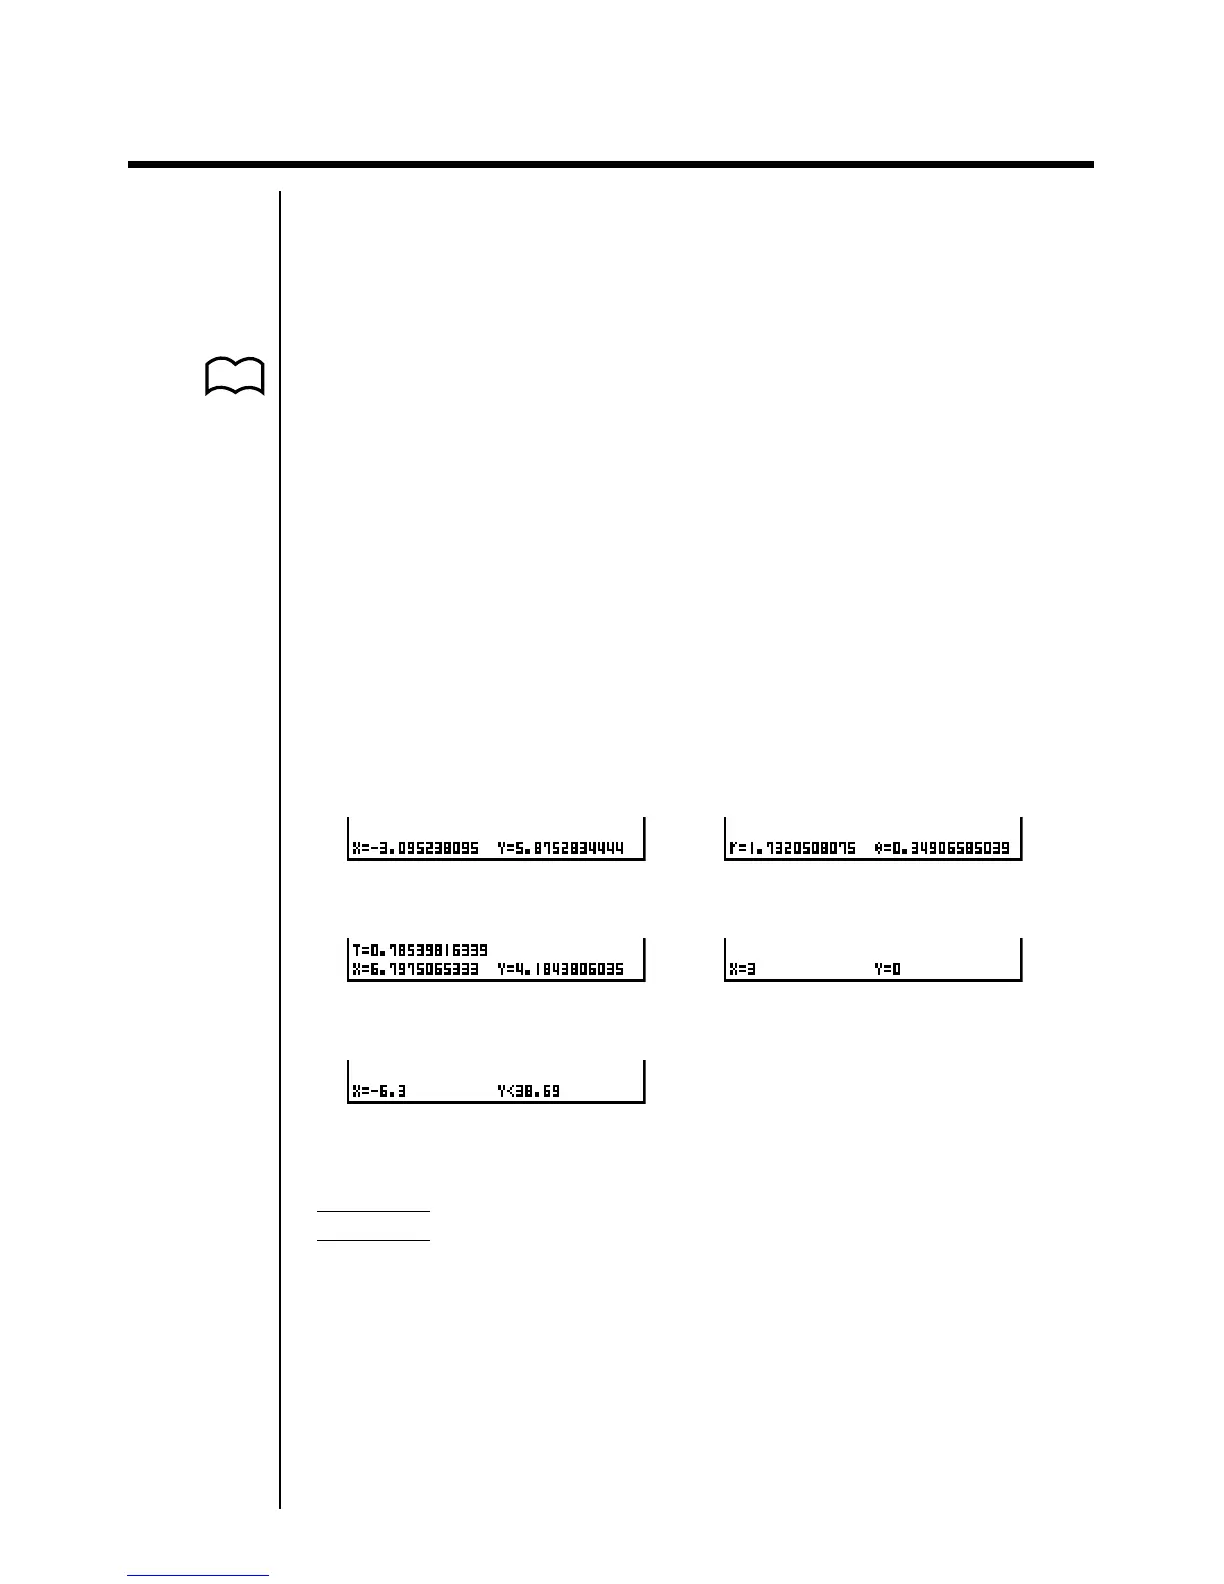
types of coordinate readouts produced by trace.
•Rectangular Coordinate Graph • Polar Coordinate Graph
•Parametric Function Graph • X = Constant Graph
•Inequality Graph
uu
uu
uTo use trace to read coordinates
Example To determine the points of intersection for graphs produced by
the following functions:
Y1 = x
2
– 3 Y2 = –x + 2
Use the following View Window parameters.
Xmin = –5 Ymin = –10
Xmax = 5 Ymax = 10
Xscale = 1 Yscale = 2
P.5