127
uu
uu
uTo draw an integration graph [Sketch]-[GRPH]-[G∫dx]
You can graph an integration calculation performed using the function
y = f(x).
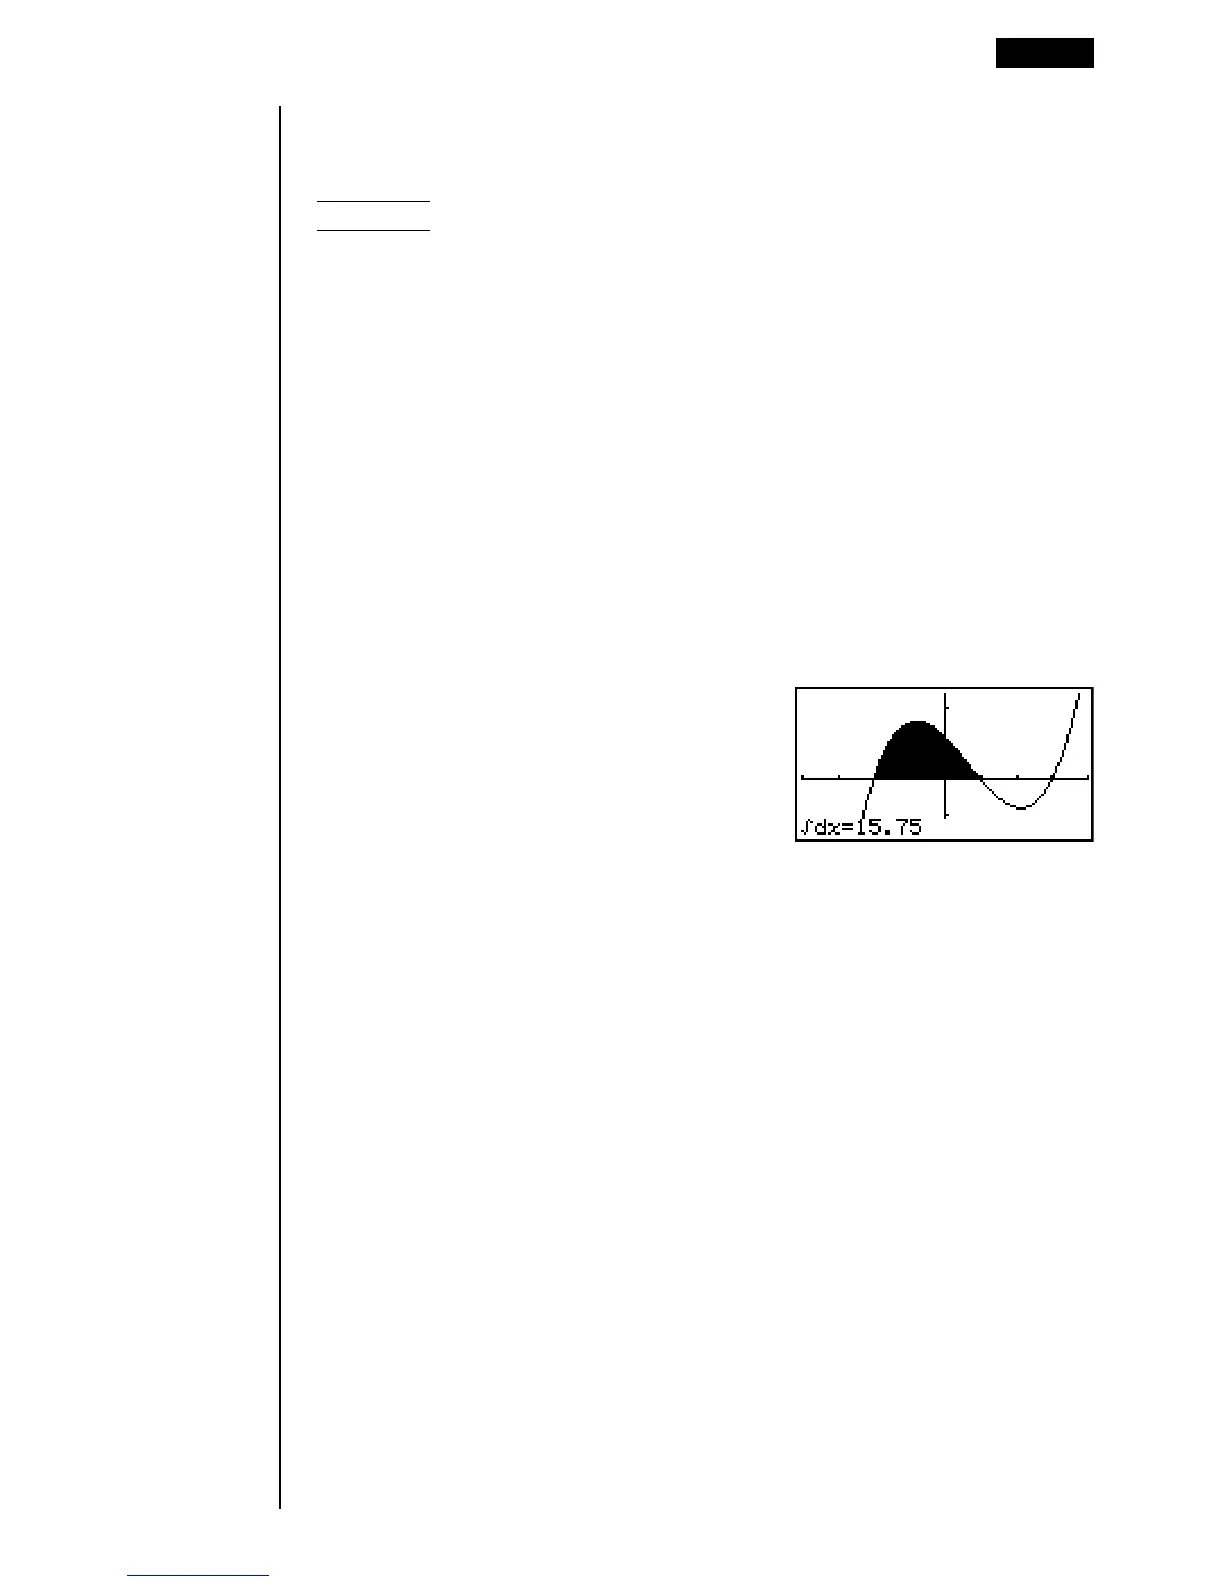
Example To graph the following, with a tolerance of “tol” = 1E - 4:
∫
–2
1
(x + 2) (x – 1) (x – 3) dx
Use the following View Window parameters.
Xmin = –4 Ymin = –8
Xmax = 4 Ymax = 12
Xscale = 1 Yscale = 5
1. In the set up screen, specify “Y=” for Func Type and then press J .
2. Input the integration graph expression.
!4(Sketch)1(Cls)w
5(GRPH)5(G∫dx)(v+c)(v-b)
(v-d),-c,b,bE-e
3. Press w to draw the graph.
•Before drawing an integration graph, be sure to always press ! 4 (Sketch)
1 (Cls) to clear the screen.
•You can also incorporate an integration graph command into programs.
Drawing Graphs Manually 8 - 5