176
12-1 Before Using Graph-to-Table
1. In the Main Menu, select the GRAPH icon and enter the GRAPH Mode. Next,
use the set up screen to set the Dual Screen item to “G to T”.
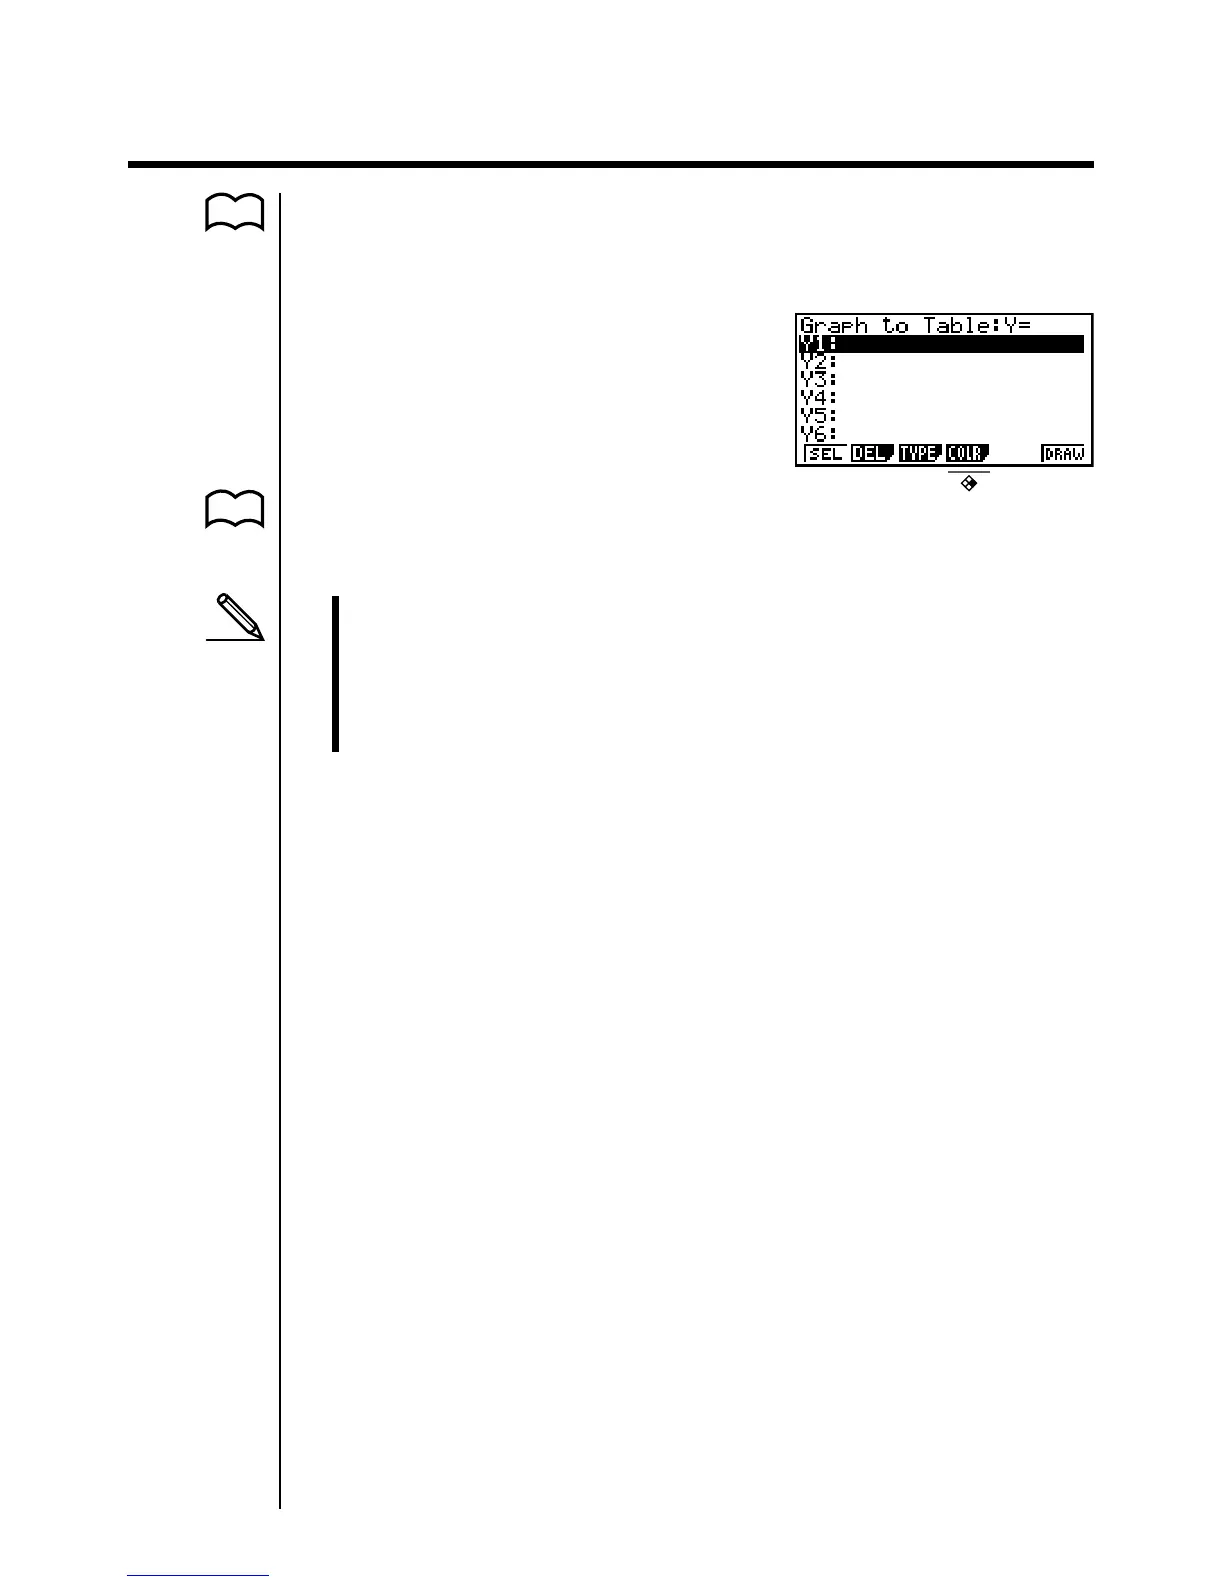
2. Press J and the Graph-to-Table menu appears.
• For the meaning of the items in the function menu at the bottom of the screen,
see “8-1 Before Trying to Draw a Graph”.
•Whenever the set up screen’s Dual Screen item is set to “G to T”, you can
only store rectangular coordinate (Y=), polar coordinate (r=), and parametric
function graphs in memory.
•You cannot use Graph-to-Table to display split graph/table screens using
X=constant or inequality graphs of functions stored in the GRAPH or TABLE
Mode.
P.7
P.112