211
15-4 Editing Tables and Drawing Graphs
You can use the table menu to perform any of the following operations once you
generate a table.
•Change the values of variable x
•Edit (delete, insert, and append) rows
• Delete a table
•Draw a connect type graph
•Draw a plot type graph
While the Table & Graph menu is on the display, press 6 (TABL) to display the
table menu.
• {FORM} ... {display function list}
• {DEL} ... {delete table}
•{ROW} ... {display menu of row operations}
•{G·CON}/{G·PLT} ... {connected type}/{draw plot type} graph draw
uu
uu
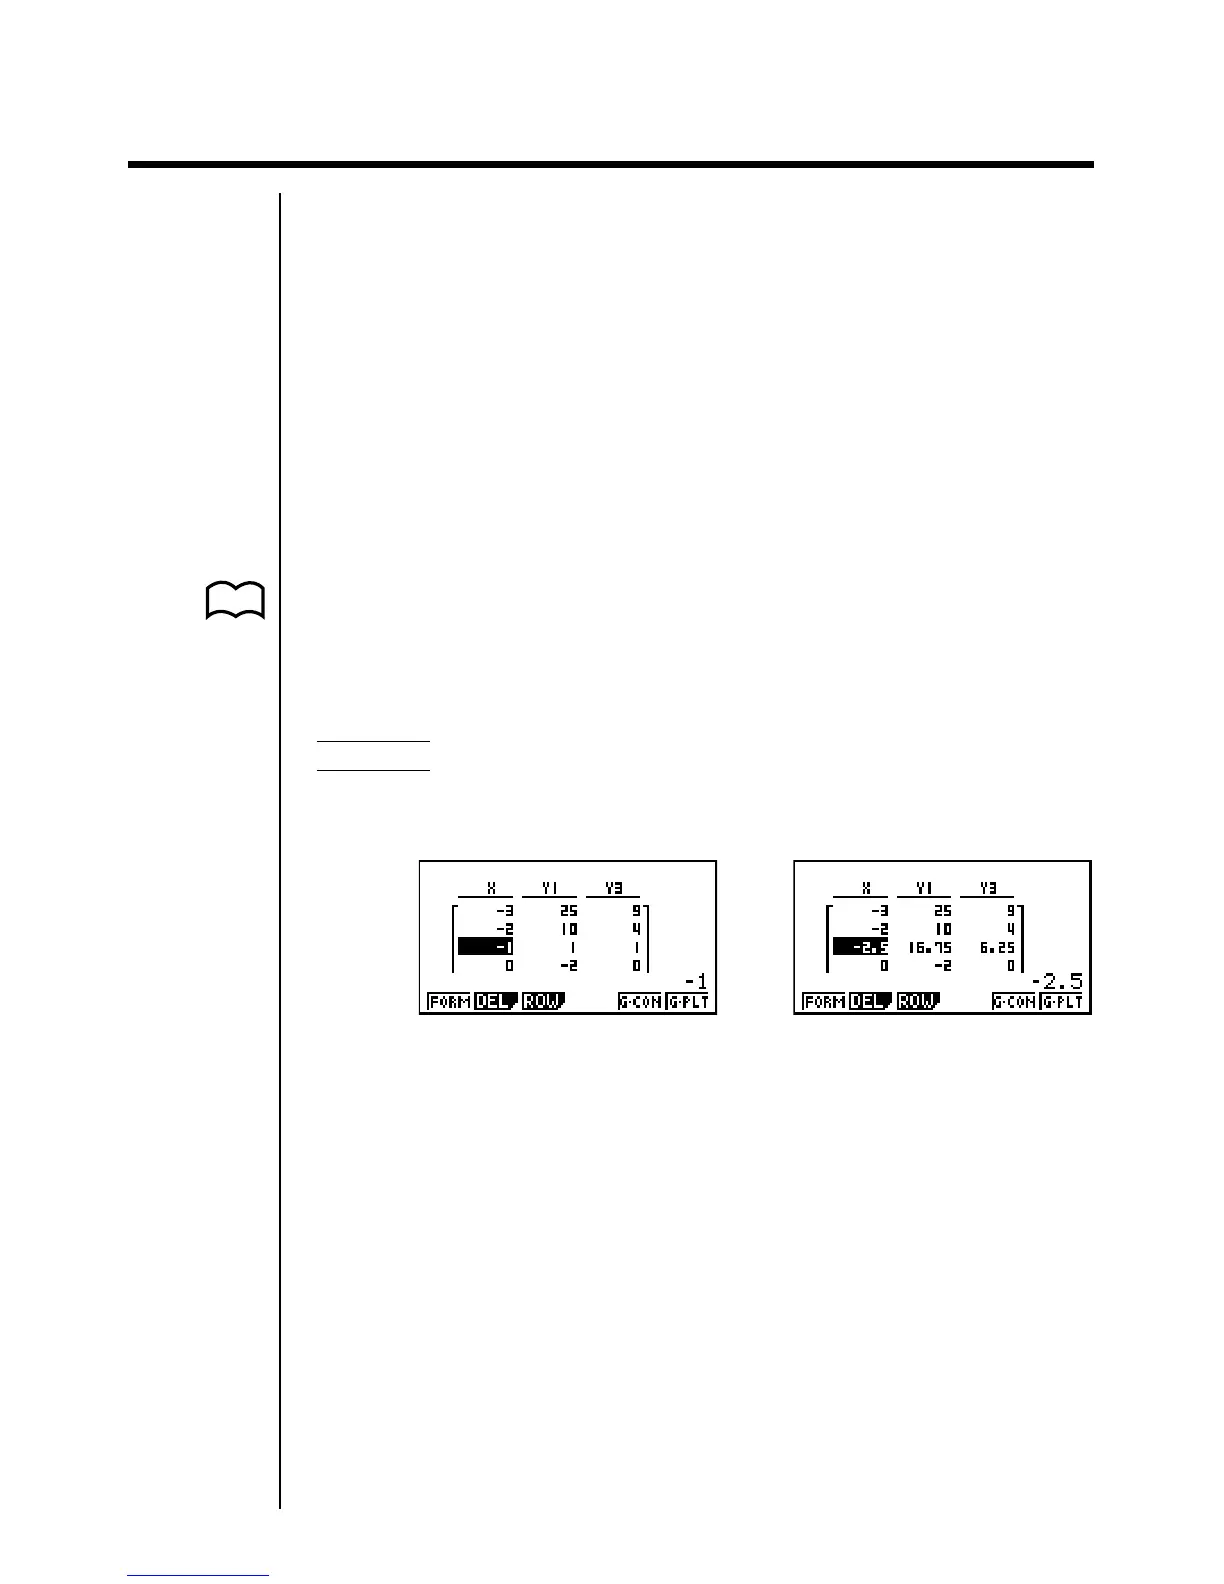
uTo change variable values in a table
Example To change the value in Column x, Row 3 of the table generated
on page 208 from – 1 to – 2.5
cc -c.fw
•When you change a variable value in Column x, all values in the columns to
the right are recalculated and displayed.
• If you try to replace a value with an illegal operation (such as division by zero),
an error occurs and the original value remains unchanged.
•You cannot directly change any values in the other (non-x) columns of the
table.
P. 128