171
11-4 Displaying a Graph in the Inactive Screen
There are two methods you can use to display a graph in the inactive screen. You
can copy a graph from the active screen to the inactive screen, or you can move
the graph from the active screen to the inactive screen. In both cases, you must
first draw the graph in the left-side active screen.
kk
kk
k Before Displaying a Graph in the Inactive Screen
After drawing a graph in the active screen, press K, and the Dual Graph
function menu appears at the bottom of the display.
• {COPY} ... {copies active graph to inactive screen}
• {SWAP} ... {switches active screen and inactive screen}
• {PICT} ... {picture function}
kk
kk
k Copying the Active Graph to the Inactive Screen
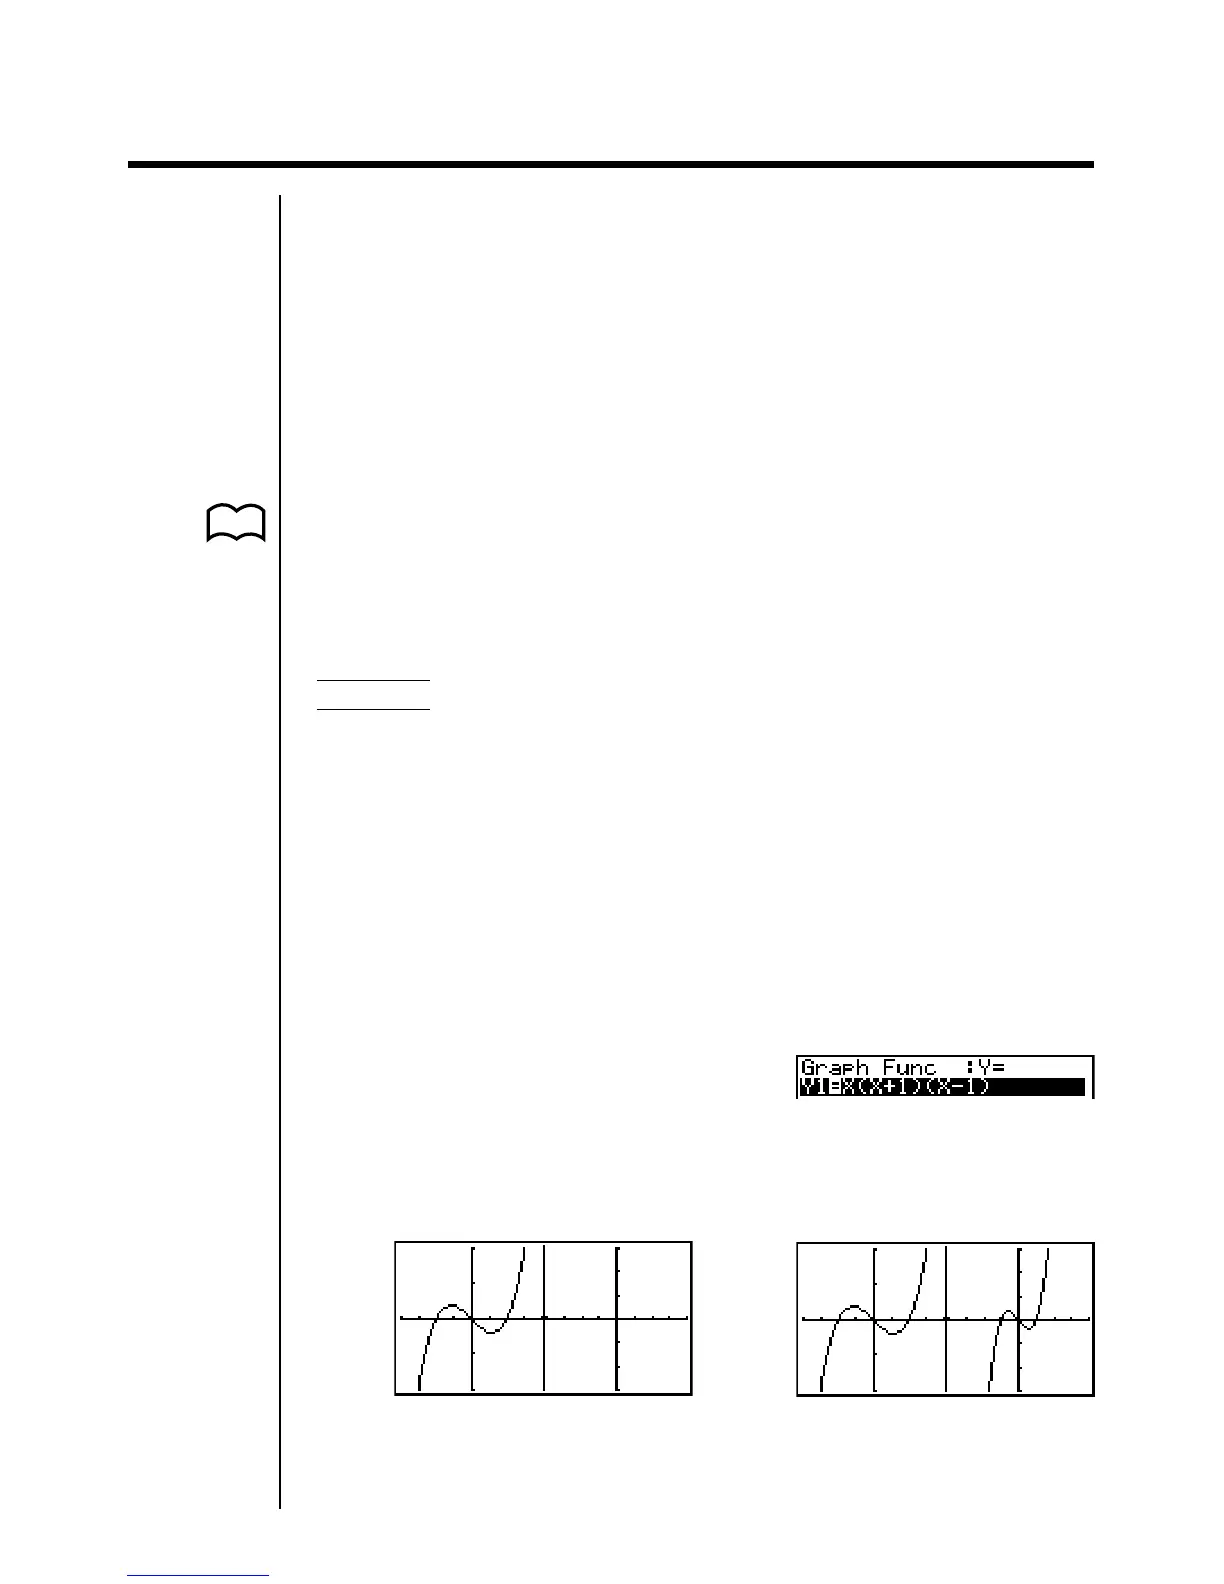
Example To draw the graph for y = x (x + 1) (x – 1) on the active screen
and the inactive screen
Use the following View Window parameters:
Active (Left) Screen Inactive (Right) Screen
View Window parameters View Window parameters
Xmin = –2 Ymin = –2 Xmin = –4 Ymin = –3
Xmax = 2 Ymax = 2 Xmax = 4 Ymax = 3
Xscale = 0.5 Yscale = 1 Xscale = 1 Yscale = 1
Assume that the function being graphed is stored in memory area Y1.
Draw the graph in the active screen. Copy the graph to the inactive
6(DRAW) (right) screen.
K1(COPY)
• The graph is reproduced using the inactive screen View Window parameters.
P. 139