191
Drawing a Dynamic Graph 13 - 3
13-5 Dynamic Graph Application Examples
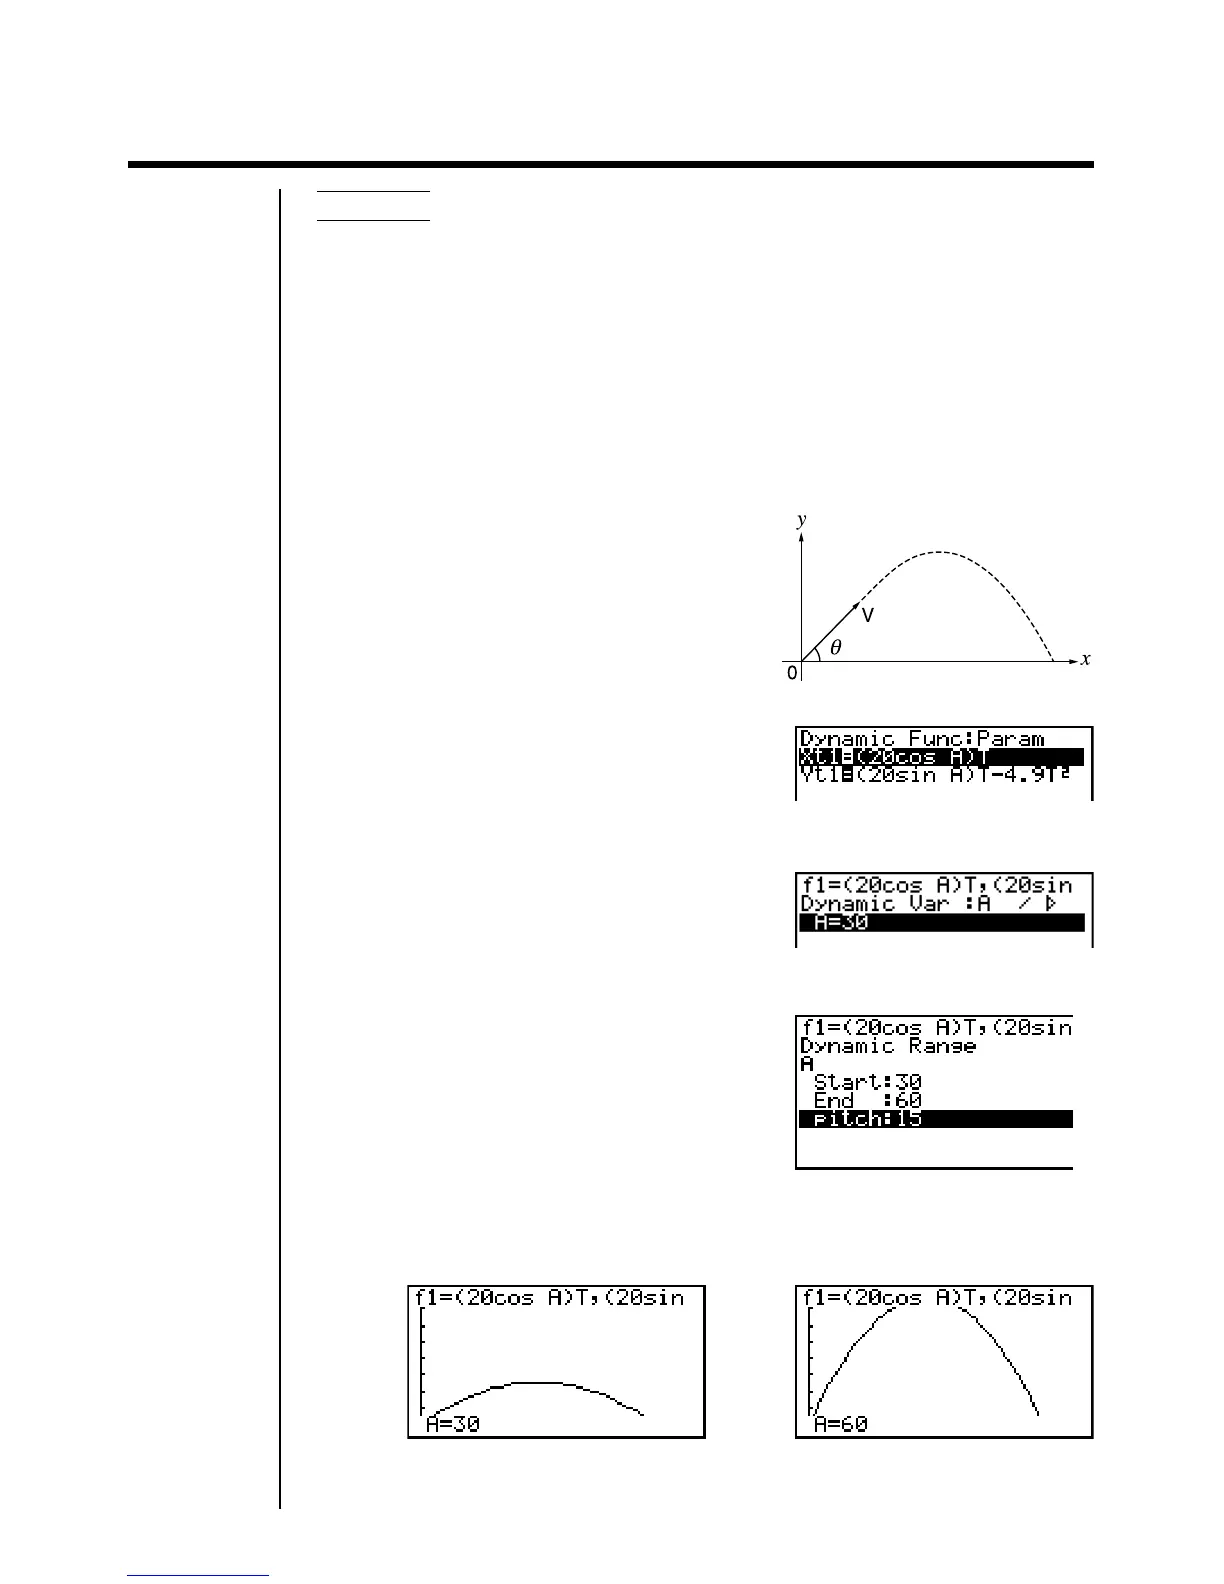
Example To use Dynamic Graph to graph the parabolas produced by
balls thrown in the air at an initial velocity of 20m/second, at
angles of 30, 45, and 60 degrees. (Angle: Deg)
Use the following View Window parameters.
Xmin = –1 Ymin = –1 T
θ
min = 0
Xmax = 42 Ymax = 16 T
θ
max = 6
Xscale = 5 Yscale = 2 pitch = 0.1
With the initial velocity defined as V and the angle defined as
θ
, the parabolas can
be obtained using the following expressions.
X = Vcos
θ
T
Y = Vsin
θ
T – (1/2)gT
2
g = 9.8 meters per second
1. Input the functions, making sure to specify
them a “Param” (parametric) type.
2. Display the coefficient menu and specify the dynamic coefficient.
4(VAR)daw
3. Display the coefficient range menu and specify the range values.
2(RANG)
dawgawbfw
4. Start the Dynamic Graph draw operation.
J6(DYNA)
···
→
←
···