126
2. Input the expression.
!4(Sketch)1(Cls)w
5(GRPH)4(X = c)d
3. Press w to draw the graph.
uu
uu
uTo graph inequalities [Sketch]-[GRPH]-[Y>]/[Y<]/[Y≥]/[Y≤]
You can graph inequalities that can be expressed in the following four formats.
• y > f
(x) • y < f
(x) • y > f
(x) • y < f
(x)
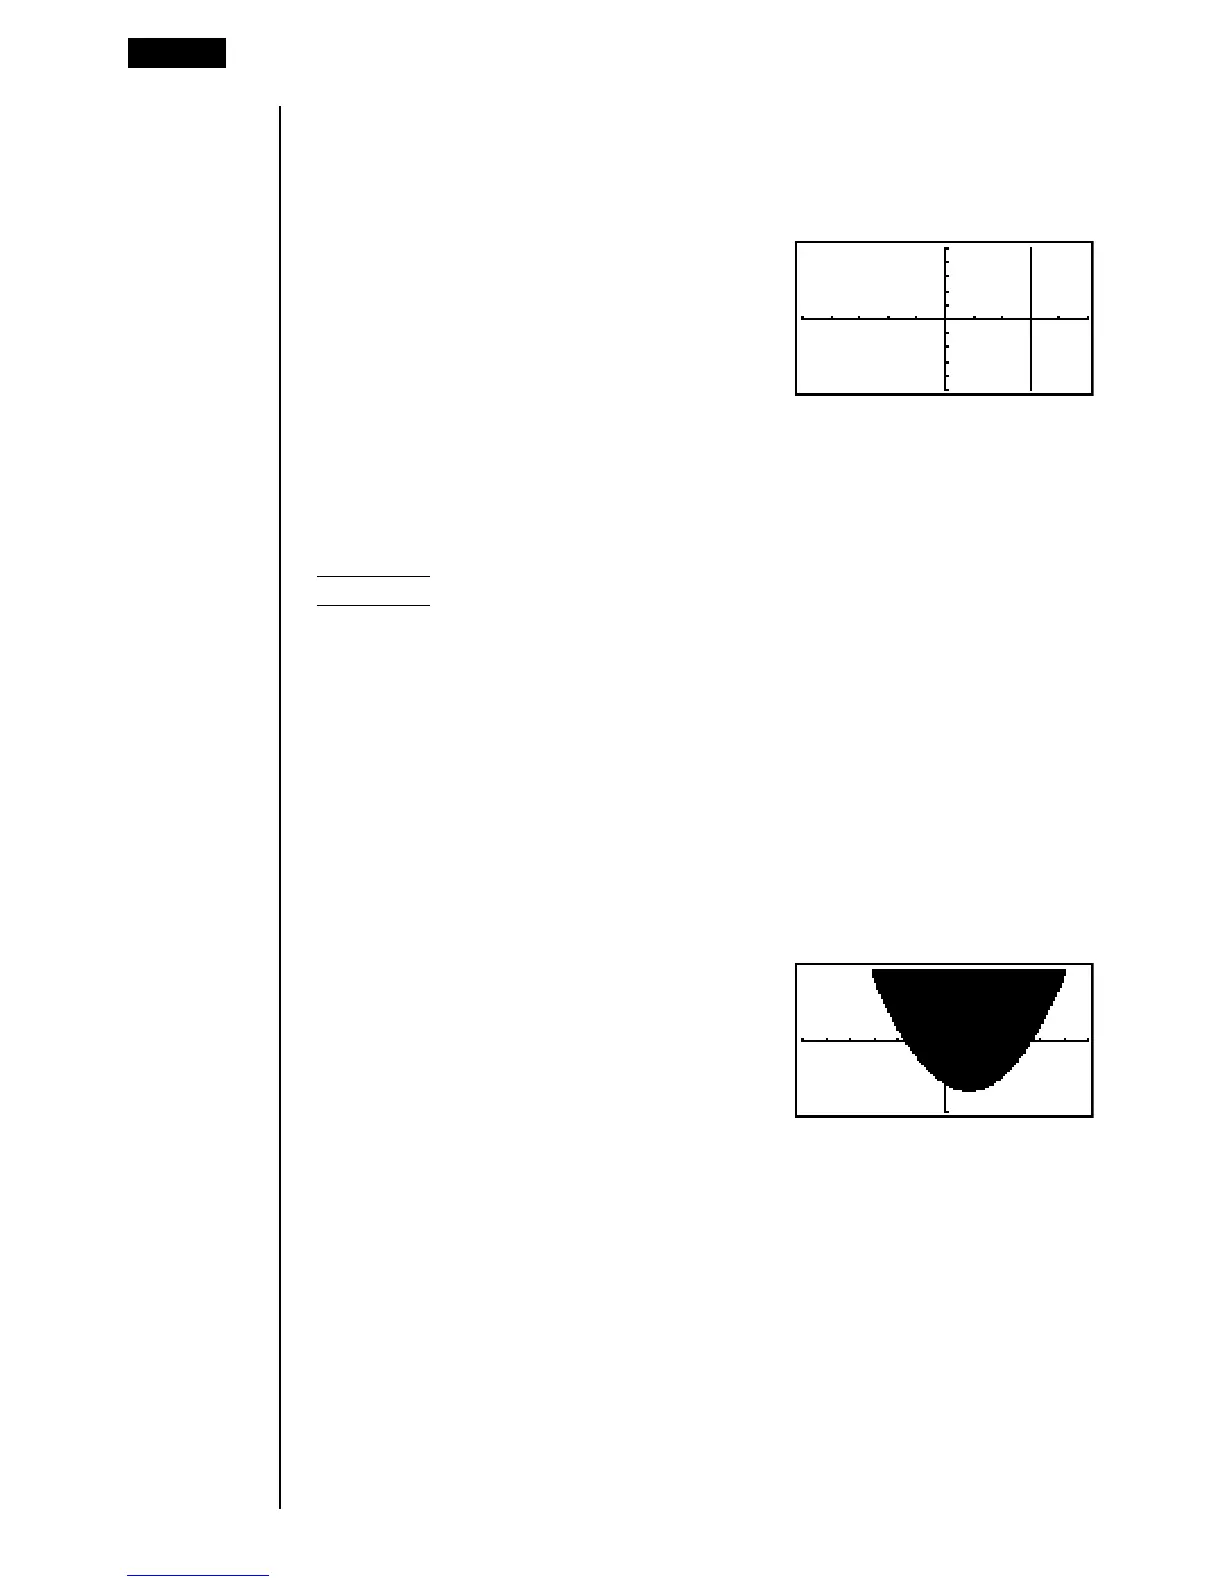
Example To graph the inequality y > x
2
– 2x – 6
Use the following View Window parameters.
Xmin = –6 Ymin = –10
Xmax = 6 Ymax = 10
Xscale = 1 Yscale = 5
1. In the set up screen, specify “Y>” for Func Type and then press J.
2. Input the inequality.
!4(Sketch)1(Cls)w
5(GRPH)6(g) 1(Y>)vx-cv-g
3. Press w to draw the graph.
8 - 5 Drawing Graphs Manually