125
uu
uu
uTo graph parametric functions [Sketch]-[GRPH]-[Parm]
You can graph parametric functions that can be expressed in the following format.
(X, Y) = (
f (T), g(T))
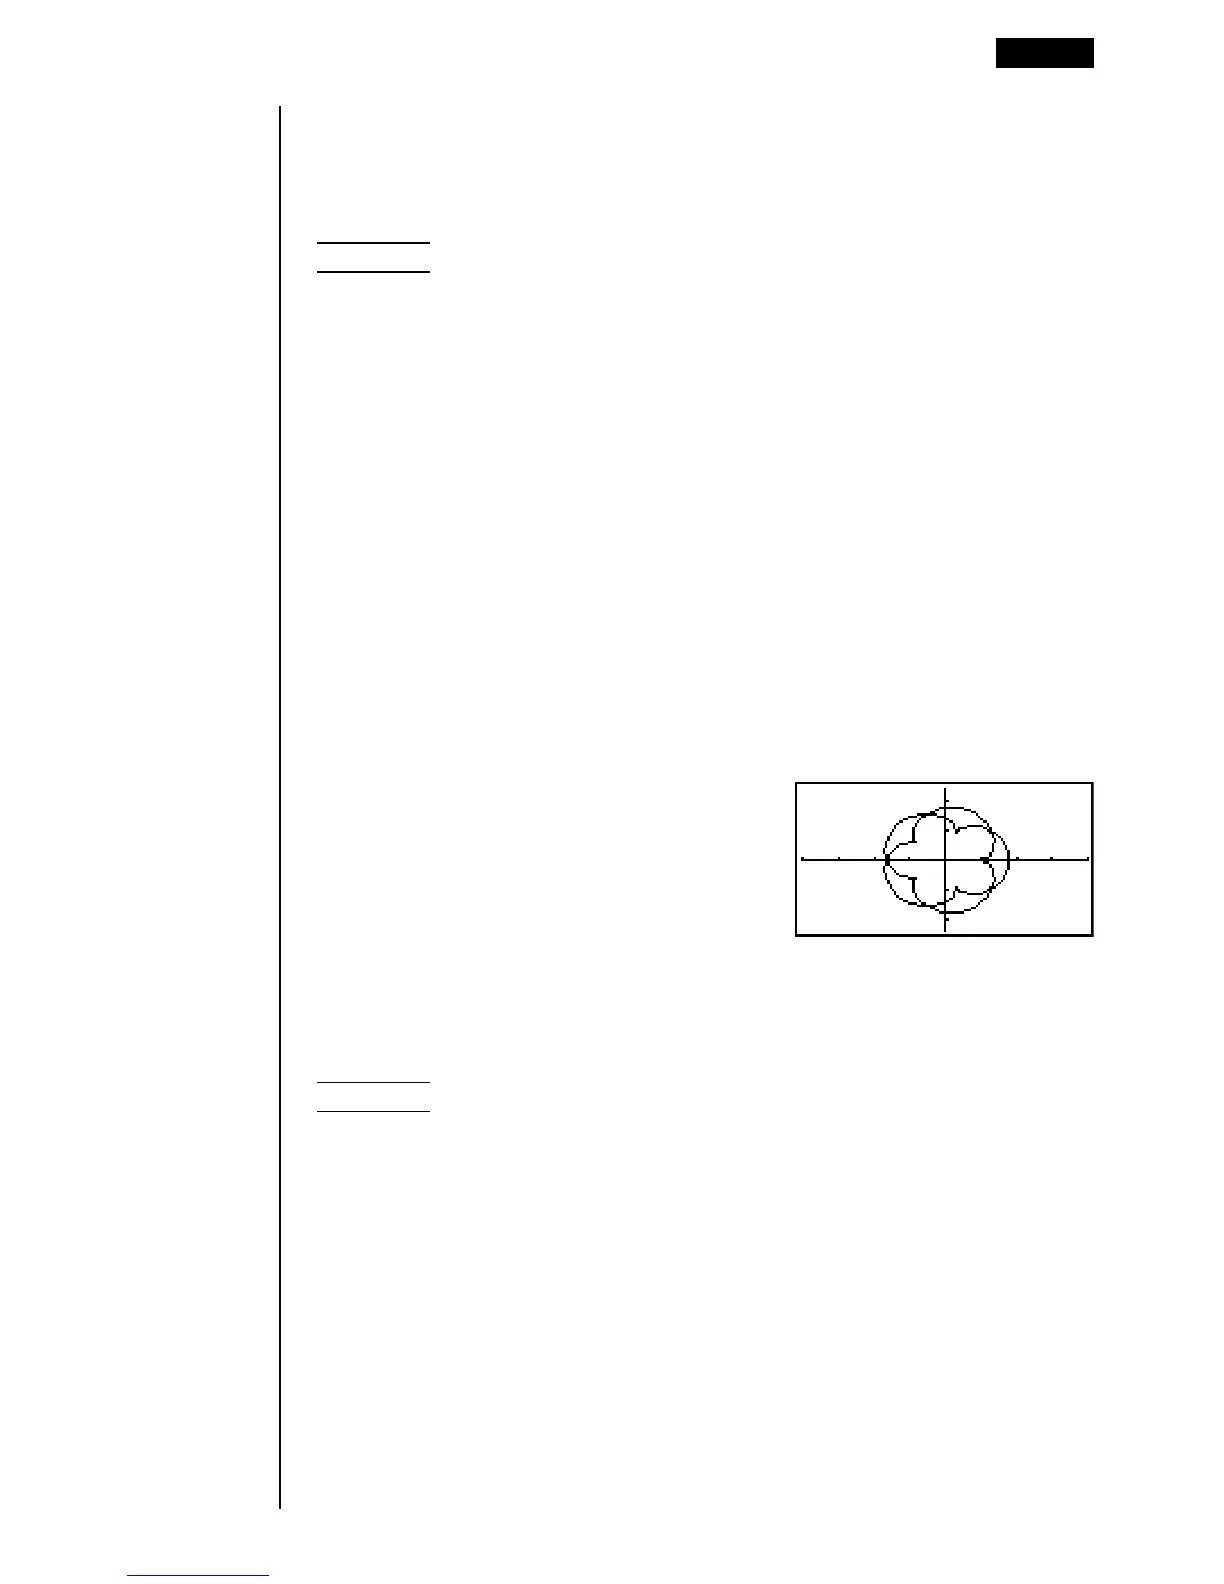
Example To graph the following parametric functions:
x = 7 cos T – 2 cos 3.5T y = 7 sin T – 2 sin 3.5T
Use the following View Window parameters.
Xmin = –20 Ymin = –12 T,
θ
min = 0
Xmax = 20 Ymax = 12 T,
θ
max = 4π
Xscale = 5 Yscale = 5 T,
θ
pitch = π÷36
1. In the set up screen, specify “Parm” for Func Type.
2. Specify “Rad” (radians) as the angle unit and then press J.
3. Input the parametric functions.
!4(Sketch)1(Cls)w
5(GRPH)3(Parm)
hcv-ccd.fv,
hsv-csd.fv)
4. Press w to draw the graph.
uu
uu
uTo graph X = constant [Sketch]-[GRPH]-[X=c]
You can graph functions that can be expressed in the format X = constant.
Example To graph X = 3
Use the following View Window parameters.
Xmin = –5 Ymin = –5
Xmax = 5 Ymax = 5
Xscale = 1 Yscale = 1
1. In the set up screen, specify “X=c” for Func Type and then press J.
Drawing Graphs Manually 8 - 5