158
10 - 2 Graphing with the Sketch Function
kk
kk
k Plotting Points
[Sketch]-[PLOT]
When plotting points on a graph, first display the sketch menu and then press 6
(g) 1 (PLOT) to display the plot menu.
• {Plot} ... {plot a point}
• {Pl·On} ... {plot point at specific coordinates}
• {Pl·Off} ... {delete point at specific coordinates}
• {Pl·Chg} ... {switch status of point at specific coordinates}
uu
uu
uTo plot points in the STAT, GRAPH, TABLE, RECUR and CONICS
Modes
[Sketch]-[PLOT]-[Plot]
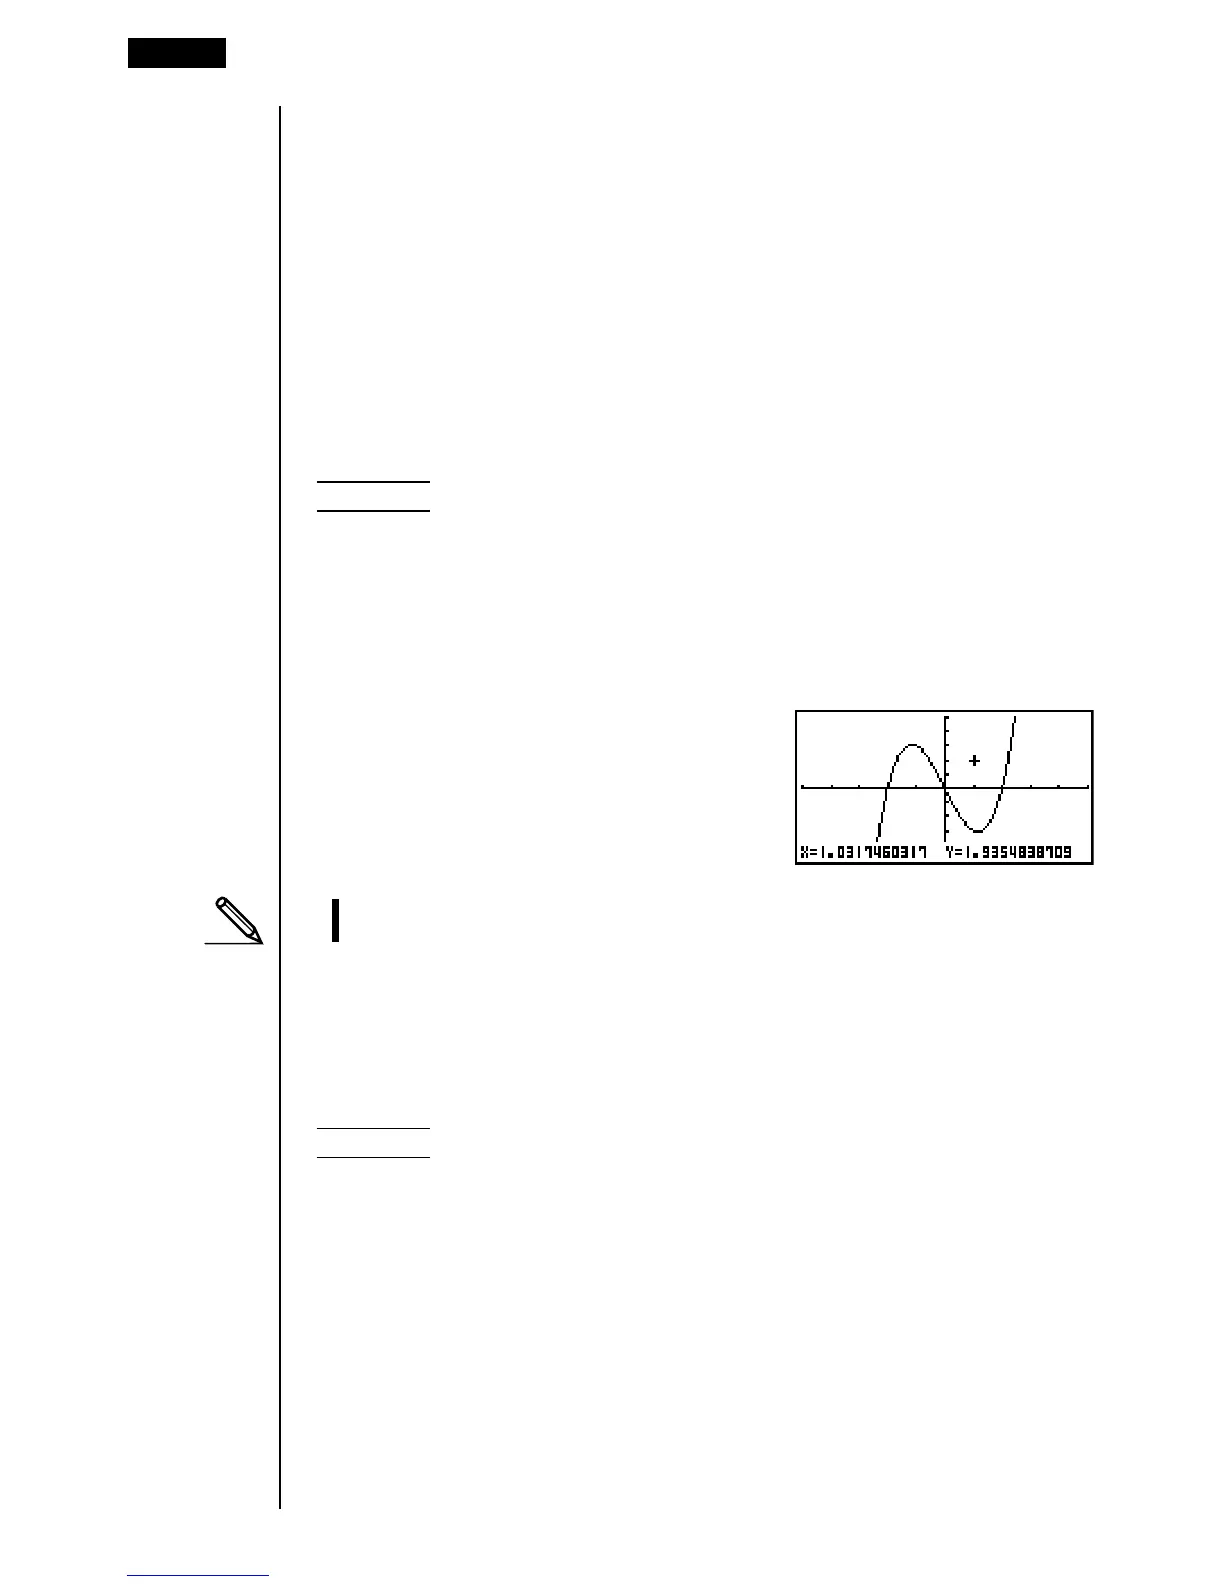
Example To plot a point on the graph of y = x(x + 2)(x – 2)
1. After drawing the graph, display the sketch menu and press 6 (g) 1 (PLOT)
1 (Plot) to display the pointer in the center of the screen.
2. Use the cursor keys to move the pointer the locations of the points you want to
plot and press w to plot.
•You can plot as many points as you want.
• The current x- and y-coordinate values are assigned respectively to variables
X and Y.
uu
uu
uTo plot points in the RUN or PRGM Mode [Sketch]-[PLOT]-[Plot]
The following is the syntax for plotting points in these modes.
Plot <x-coordinate>, <y-coordinate>
Example To plot a point at (2, 2)
Use the following View Window parameters.
Xmin = –5 Ymin = –10
Xmax = 5 Ymax = 10
Xscale = 1 Yscale = 2