187
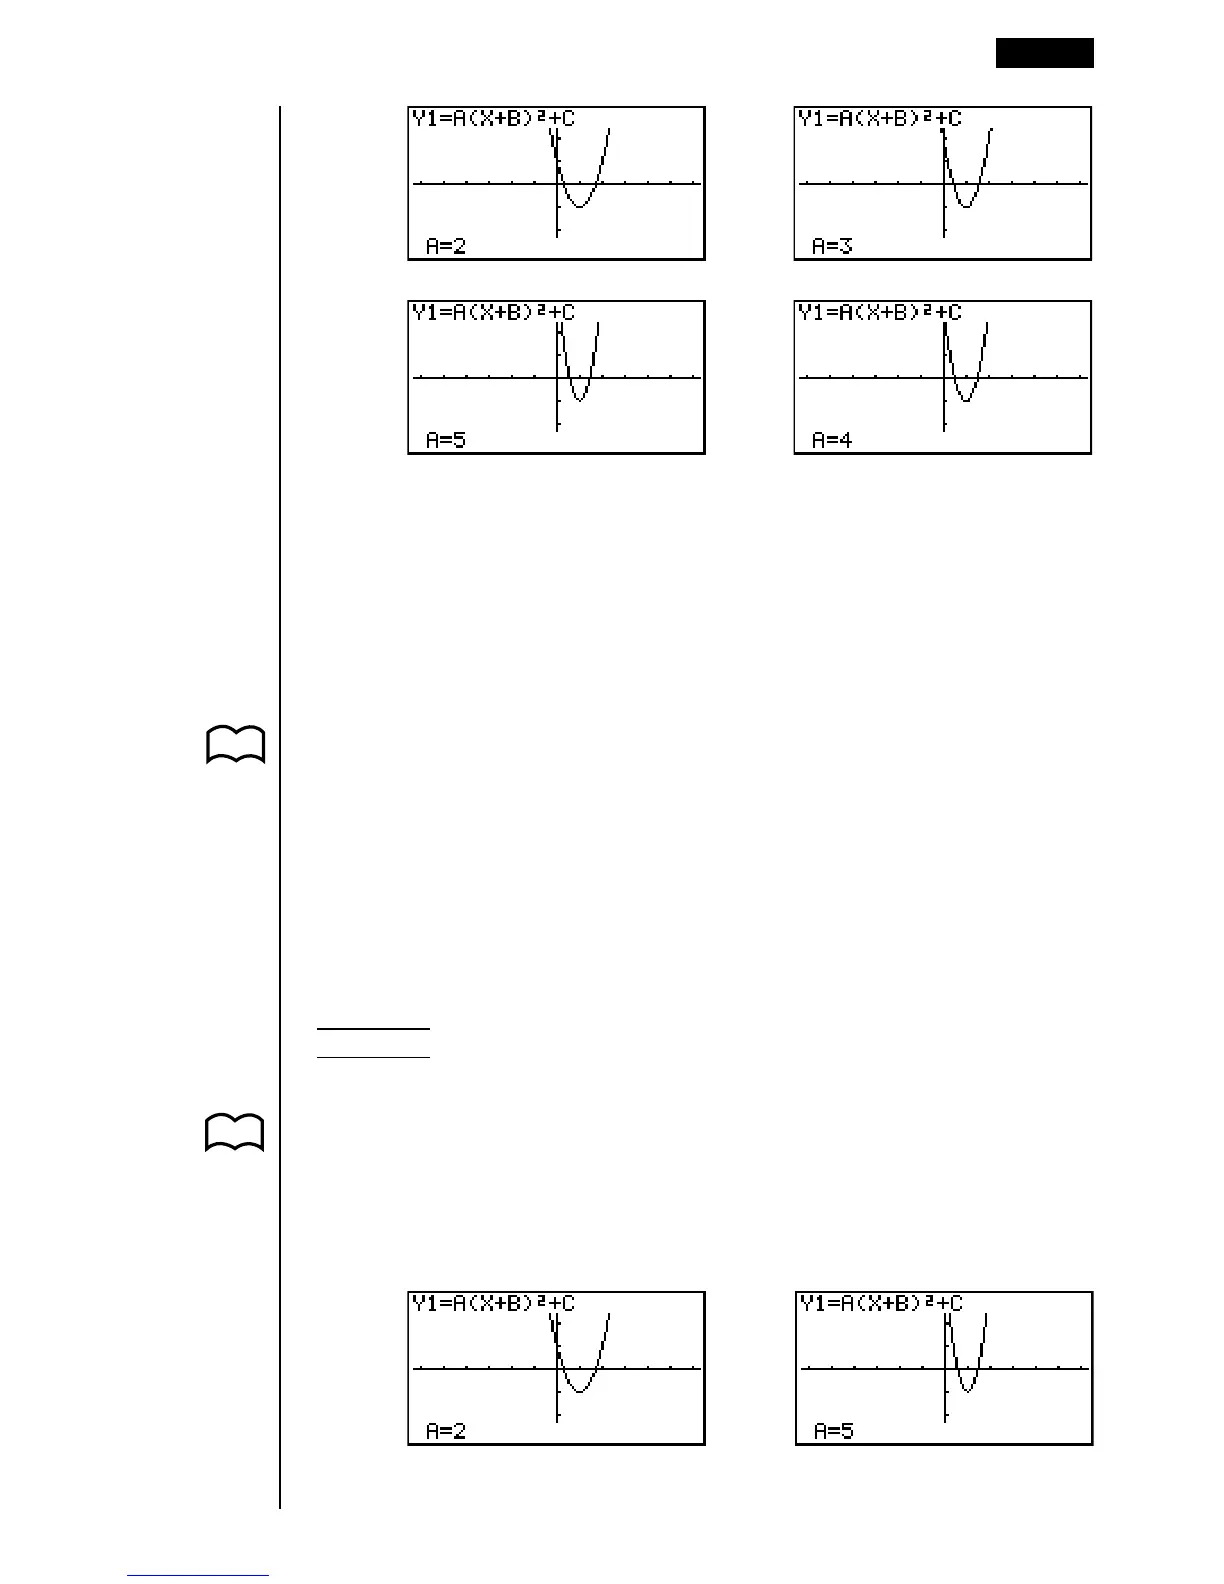
→
←
↓↑
→
←
The above sequence continues to repeat from 1 through 4.
Graph is drawn 10 times.
•While the message “One Moment Please!” is shown on the display, you can
press A to interrupt drawing of the graph and return to the coefficient range
setting display.
•Pressing A while the Dynamic Graph is being drawn changes to the drawing
speed setting display. The draw operation is suspended at this time, and you
can view the graph by pressing !6 (G ↔ T).
• If you do not want the function and coefficient values shown on the display with
the graph, use the graph function set up display to switch Graph Func “Off”.
•Pressing 5 (AUTO) draws up to 11 versions of the Dynamic Graph, starting
from the start (Start) value of the dynamic coefficient.
kk
kk
k Continuous Drawing
When the Dynamic Graph draw type (Dynamic Type) is set to “Cont” (continuous),
drawing of the Dynamic Graph continues until you press A.
Example To continuously draw the same graph that you input in the
previous example (page 184)
1. Display the coefficient menu. Next, display the set up screen and specify
“Cont” for Dynamic Type and then press J.
2. Start drawing of the Dynamic Graph.
6(DYNA)
···
→
←
···
Drawing a Dynamic Graph 13 - 3
1
4
2
3
P.6
P.7