196
14 - 2 Graphing a Conic Section
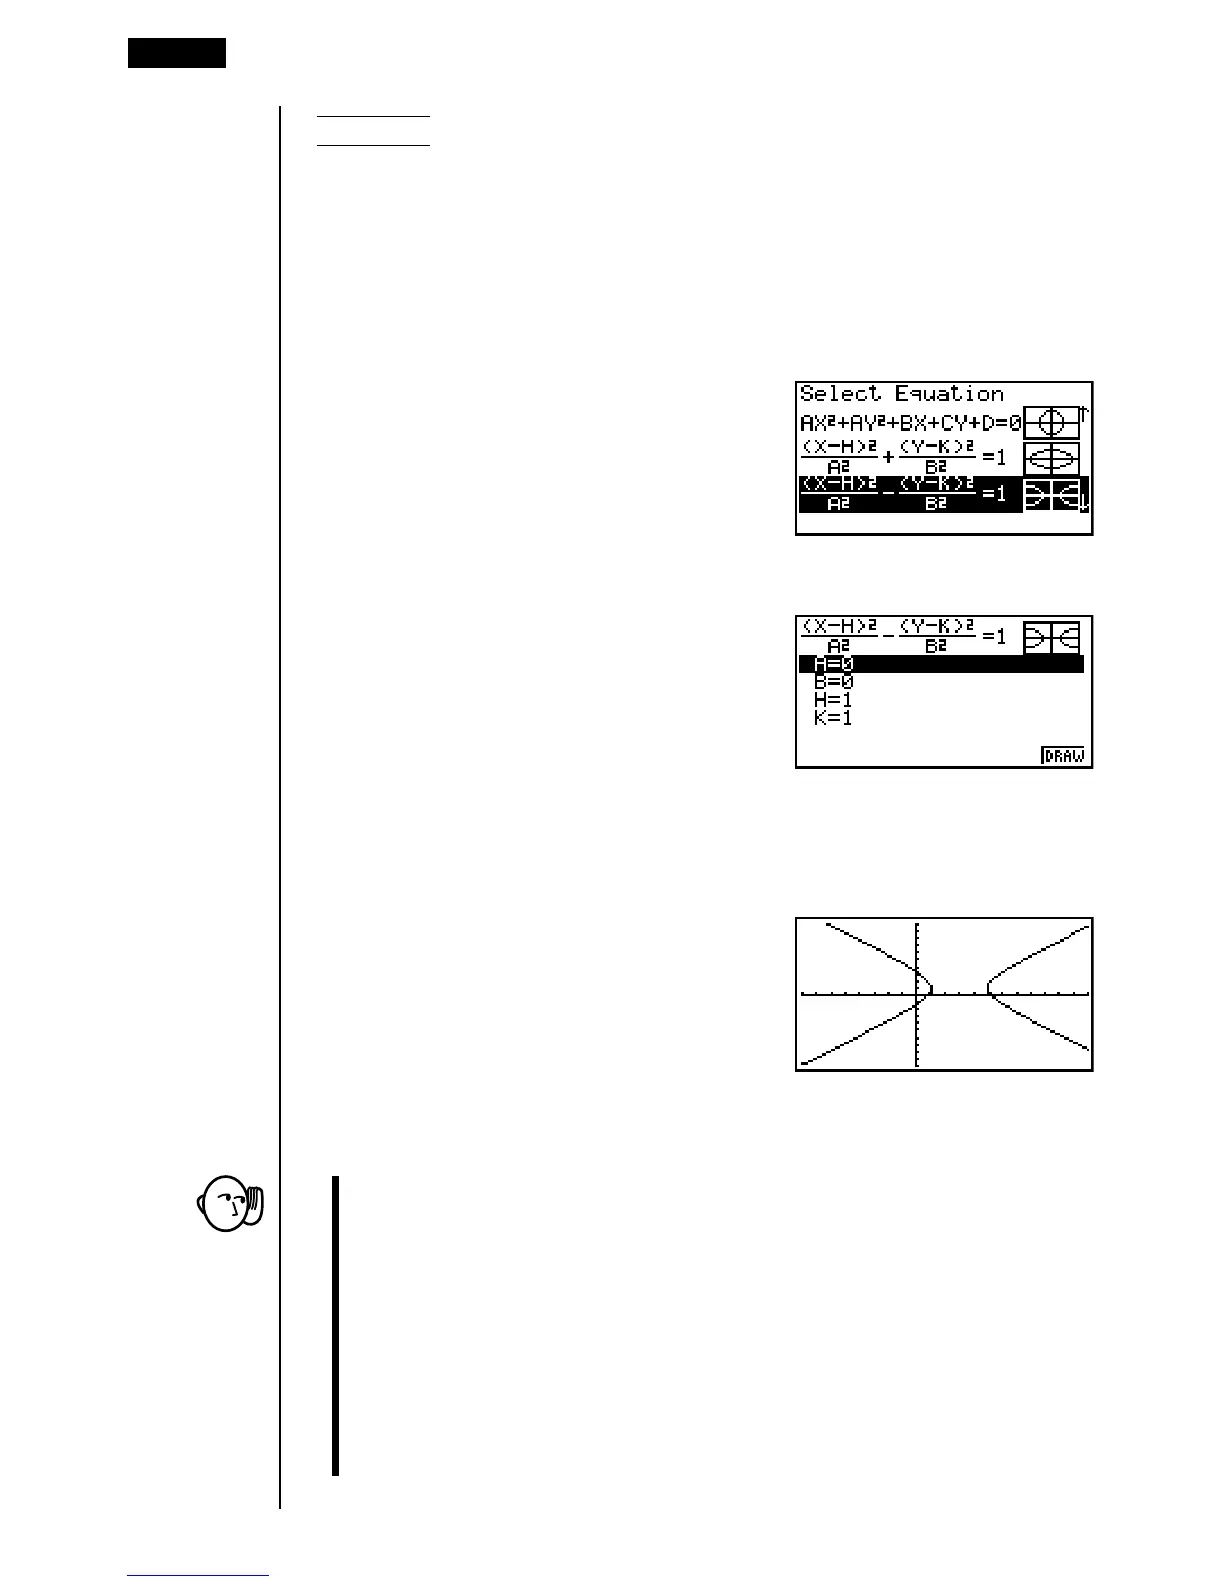
(X – 3)
2
(Y – 1)
2
Example 2 To graph the hyperbola –––––––––– – –––––––––– = 1
2
2
2
2
Use the following View Window parameters.
Xmin = –8 Ymin = –10
Xmax = 12 Ymax = 10
Xscale = 1 Yscale = 1
1. Select the function whose graph you want to draw.
ccccccc
2. Press w and the variable input screen appears.
3. Assign values to each variable.
cwcwdwbw
4. Press 6 (DRAW) to draw the graph.
kk
kk
k Conic Section Graphing Precautions
•Assigning the following types of values to variables contained in built-in
function produces an error.
(1) Parabola graph
A = 0
(2) Circle graph
R = 0 for (X – H)
2
+ (Y – K)
2
= R
2
A = 0 for AX
2
+ AY
2
+ BX + CY + D = 0
(3) Ellipse/hyperbola graph
A = 0 or B = 0