202
uu
uu
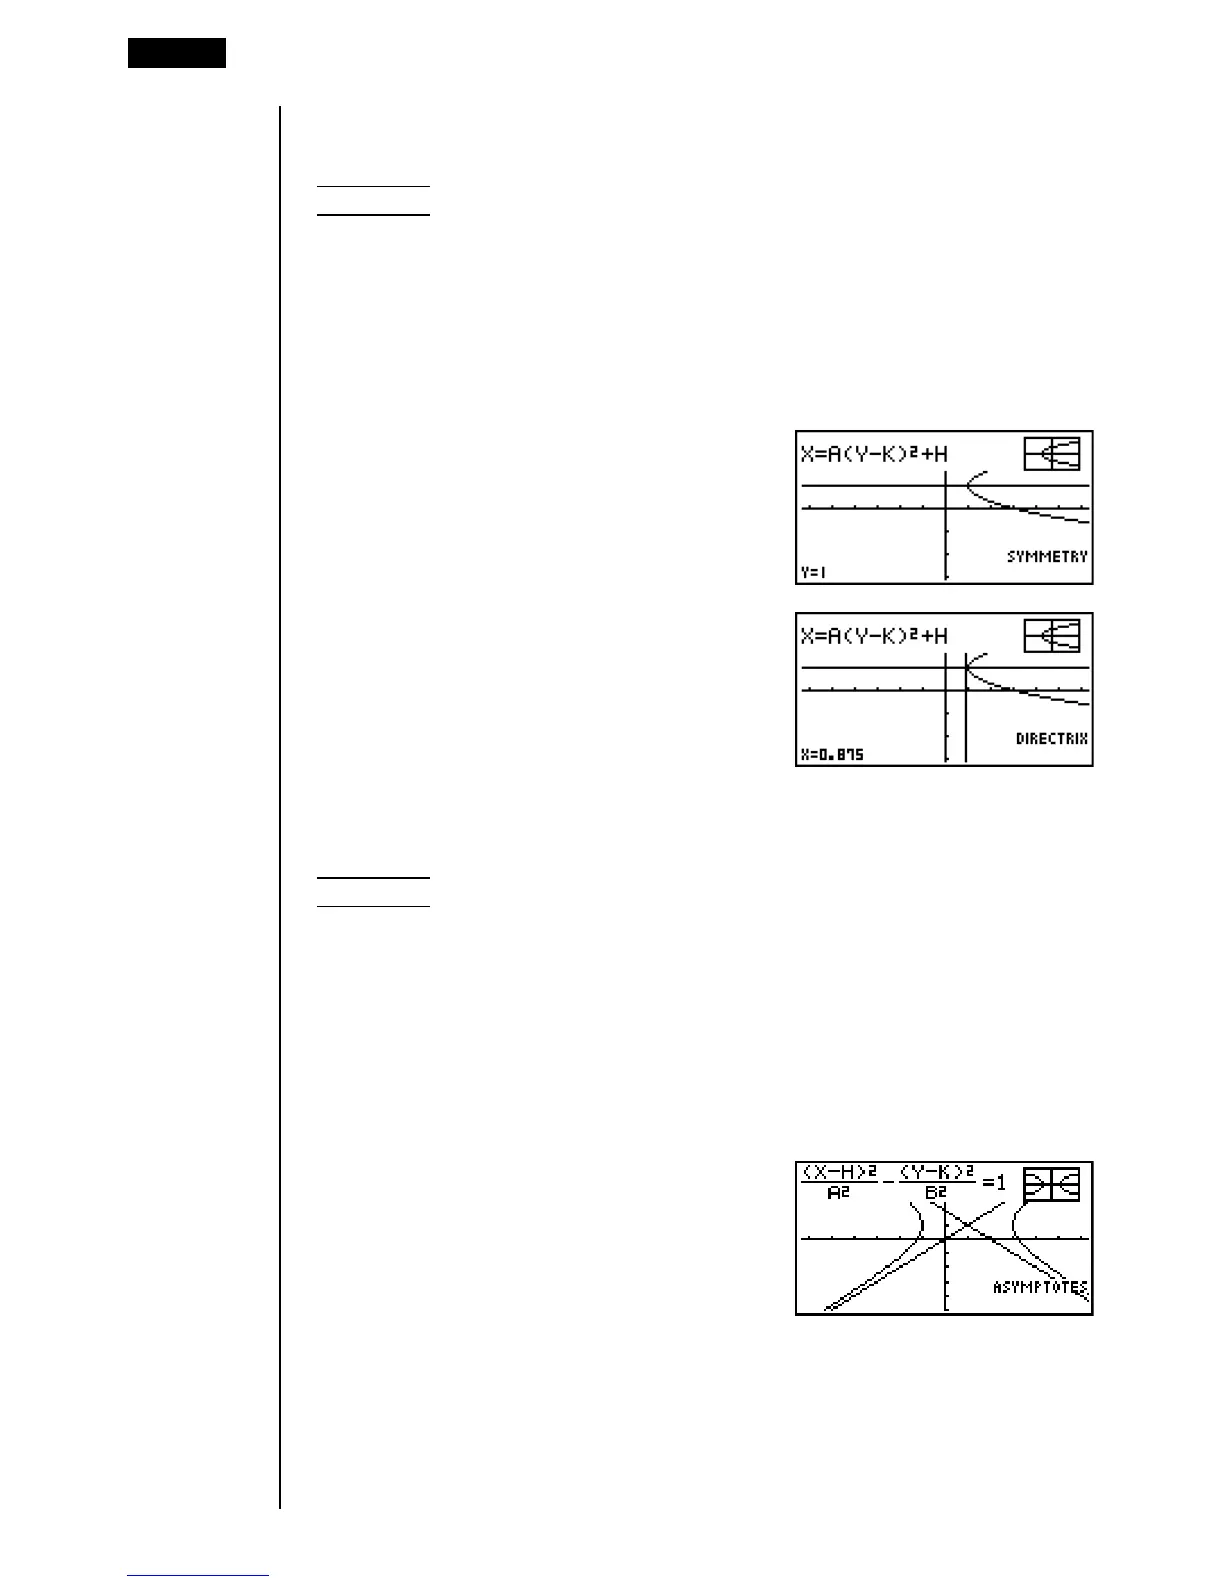
uTo draw and analyze the axis of symmetry and directrix
[G-Solv]-[SYM]/[DIR]
Example To draw the axis of symmetry and directrix for the parabola
X = 2(Y – 1)
2
+ 1
Use the following View Window parameters.
Xmin = –6.3 Ymin = –3.1
Xmax = 6.3 Ymax = 3.1
Xscale = 1 Yscale = 1
5 (G-Solv)
2 (SYM)
(Draws the axis of symmetry.)
5 (G-Solv)
3 (DIR)
(Draws the directrix.)
uu
uu
uTo draw and analyze the asymptotes [G-Solv]-[ASYM]
Example To draw the asymptotes for the hyperbola
(X – 1)
2
(Y – 1)
2
–––––––––– – –––––––––– = 1
2
2
2
2
Use the following View Window parameters.
Xmin = –6.3 Ymin = –5
Xmax = 6.3 Ymax = 5
Xscale = 1 Yscale = 1
5 (G-Solv)
5 (ASYM)
(Draws the asymptotes.)
14 - 3 Conic Section Graph Analysis