214
uu
uu
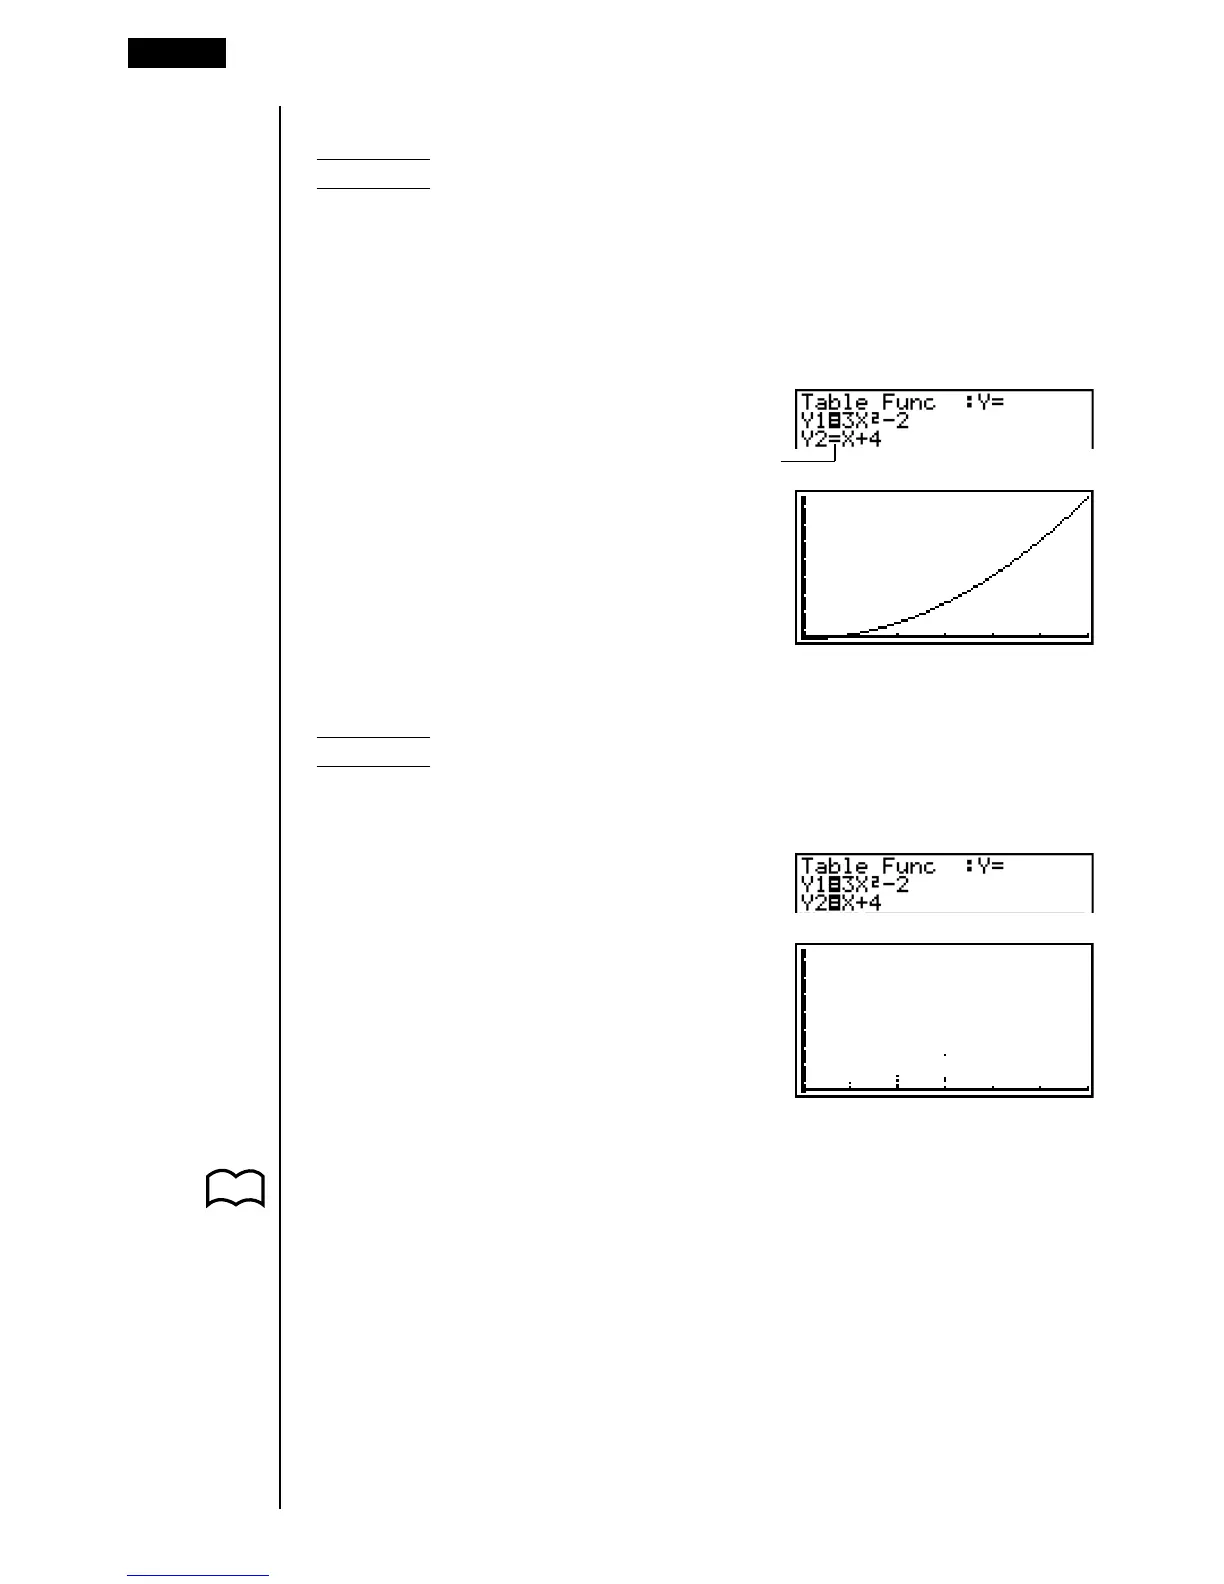
uTo graph only a selected function
Example To graph y = 3x
2
– 2, which is stored in memory area Y1, as a
connect type graph.
Use the following View Window parameters.
Xmin = 0 Ymin = –2
Xmax = 6 Ymax = 106
Xscale = 1 Yscale = 2
c1(SEL)
(Specifies graph non-draw.)
6(TABL) 5(G·CON)
(Specifies connect type graph.)
uu
uu
uTo graph all of the functions
Example To use the values in the numeric table generated using the
Table Range and the View Window parameters from the
previous example to graph all functions stored in memory as
plot type graphs.
6(TABL) 6(G·PLT)
(Specifies plot type graph.)
•After you graph a function, you can press !6 (G↔T) or A to return to the
function’s numeric table.
•After graphing a function, you can use the trace, zoom, sketch functions. For
details, see “8-6 Other Graphing Functions”.
15 - 4 Editing Tables and Drawing Graphs
No highlighting
P. 128