259
Calculating and Graphing Single-Variable Statistical Data 18 - 3
kk
kk
k Broken Line Graph
P. 254 A broken line graph is formed by plotting the data in one list against the frequency
(Graph Type) of each data item in another list and connecting the points with straight lines.
(Brkn) Calling up the graph menu from the statistical data list, pressing 6 (SET),
changing the settings to drawing of a broken line graph, and then drawing a graph
creates a broken line graph.
⇒
6(DRAW)
6
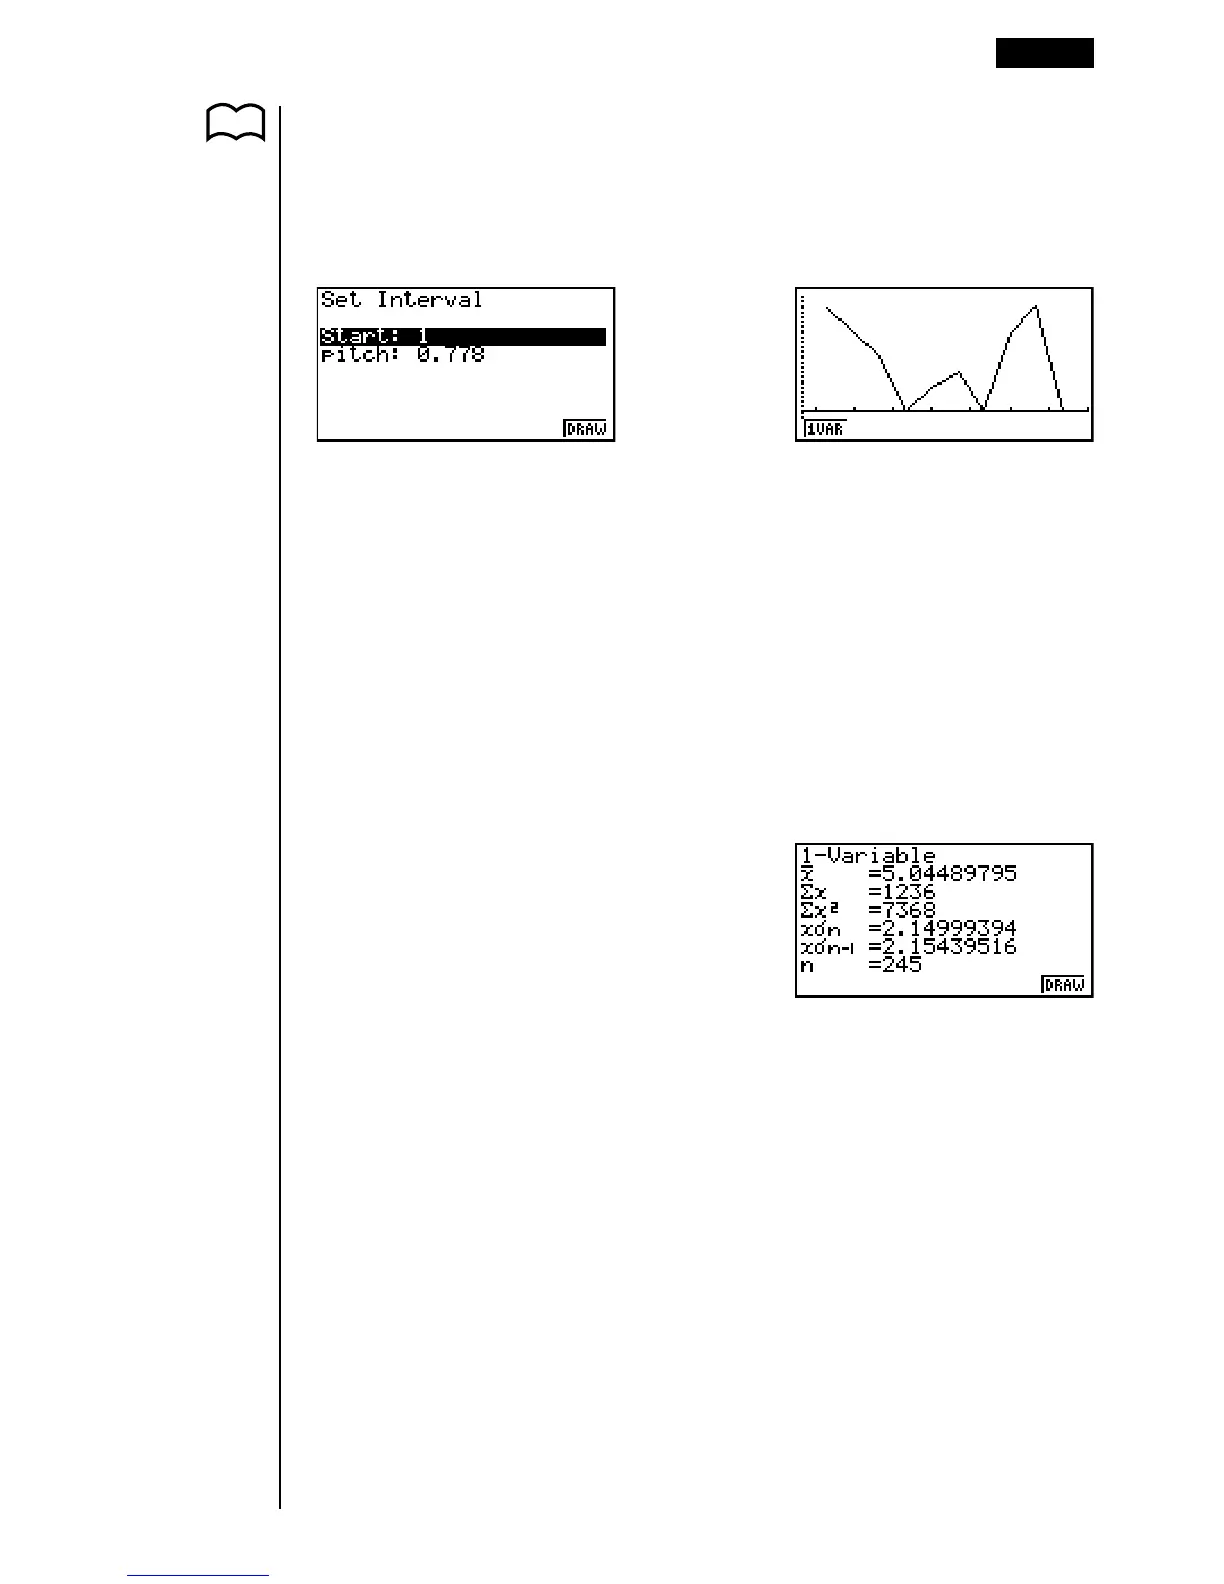
The display screen appears as shown above before the graph is drawn. At this
point, you can change the Start and pitch values.
kk
kk
k Displaying Single-Variable Statistical Results
Single-variable statistics can be expressed as both graphs and parameter values.
When these graphs are displayed, the menu at the bottom of the screen appears
as below.
• {1VAR} ... {single-variable calculation result menu}
Pressing 1 (1VAR) displays the following screen.
•Use c to scroll the list so you can view the items that run off the bottom of the
screen.
The following describes the meaning of each of the parameters.
_
x ..................... mean of data
Σx ................... sum of data
Σx
2
.................. sum of squares
xσn .................. population standard deviation
xσn-1 ................ sample standard deviation
n ..................... number of data items